Grafana Cloud
Observe and act
Monitor infrastructure
Database Observability
Monitor
Link traces and queries
Link traces and database queries
Trace linkage connects your application traces to the database queries they run, so you can move between the two in either direction:
- From a trace to a query. In Explore or Traces Drilldown, a database span can show a Database Observability link. Selecting it takes you to that query in Database Observability, where you can see its samples, latency, and history.
- From a query back to a trace. When a query sample carries trace context, you can jump from the query back to the trace of the request that ran it.
Why this is useful
When an application request is slow, a trace usually shows that a database call was slow, but not why. Trace linkage lets you cross from that span into the query’s full picture in Database Observability: whether it’s habitually slow, what it runs against, and how often it executes. Going the other way, when you find a problem query, you can trace it back to the user-facing request that triggered it, instead of guessing which part of the application is responsible.
Before you begin
Trace linkage requires an application instrumented with an OpenTelemetry SDK that sends traces to Grafana Cloud.
The database spans must include:
- Query text in
db.query.textordb.statement - A supported database system in
db.system.nameordb.system:mysqlorpostgresql
What to expect
Trace linkage is best-effort correlation, not a guaranteed link on every span. Database Observability matches in two ways:
- Query text match is the default and needs no additional application changes. It matches the span’s query text against the queries Database Observability has collected.
- Exact trace match is more precise but requires sqlcommenter instrumentation. It can link to the single query execution behind a specific span using its trace ID and span ID.
The following video shows an exact trace match opening the corresponding query in Database Observability.
When Database Observability matches a span to a query, it opens the Query samples tab in the Query details view. If multiple database instances contain the query, you may first be asked to select an instance.
How to enable exact trace matching
Exact trace match is an advanced optional enhancement to trace linkage matching. Exact trace match only improves the precision of the matches, not how often a link resolves.
- Enable sqlcommenter in your application’s OpenTelemetry SDK instrumentation. sqlcommenter appends a W3C
traceparentcomment to SQL queries. For the setting to turn on in each language, refer to Enable sqlcommenter in your application. - Use Alloy 1.17.0 or later. If you can’t upgrade from an earlier version, set
disable_query_redaction = truein thequery_samplesblock as a fallback.
Enable sqlcommenter in your application
sqlcommenter appends a comment to each SQL statement before your application sends it to the database. The comment holds key='value' pairs. Exact trace match uses the traceparent pair, which is the W3C trace context of the request:
SELECT * FROM orders WHERE customer_id = ? /*traceparent='00-5bd66ef5095369c7b0d1f8f4bd33716a-c532cb4098ac3dd2-01'*/The traceparent value carries the trace ID and span ID that was active when the comment was added.
The OpenTelemetry semantic conventions treat sqlcommenter as an opt-in feature, so no instrumentation adds the comment by default.
The following snippets show only the setting that adds the comment. Keep the rest of your OpenTelemetry setup as it is.
Python
The SQLAlchemy instrumentation creates the spans and adds the comment. Set enable_commenter=True when you instrument the engine. The traceparent pair is included by default. commenter_options only lets you opt out of pairs you don’t want.
from opentelemetry.instrumentation.sqlalchemy import SQLAlchemyInstrumentor

SQLAlchemyInstrumentor().instrument(
    engine=engine,
    enable_commenter=True,
)
Call it once per engine, right after create_engine(). The DB-API driver instrumentations (Psycopg2Instrumentor, PsycopgInstrumentor, MySQLClientInstrumentor, and PyMySQLInstrumentor) accept enable_commenter=True as well.
Node.js
The mysql2 and pg instrumentations create the spans and take a built-in sqlcommenter option. Set addSqlCommenterCommentToQueries: true on each.
const { MySQL2Instrumentation } = require('@opentelemetry/instrumentation-mysql2');
const { PgInstrumentation } = require('@opentelemetry/instrumentation-pg');

const instrumentations = [
  new MySQL2Instrumentation({ addSqlCommenterCommentToQueries: true }),
  new PgInstrumentation({ addSqlCommenterCommentToQueries: true }),
];
The SDK has to patch mysql2 and pg before your application code loads them, so register the instrumentations in a file you preload, for example with node -r ./otel.js. These instrumentations don’t add a comment to a query that already contains -- or /* */, even inside a string literal.
Go
otelsql creates a database client span per query and has a built-in WithSQLCommenter option that appends the traceparent comment using the global text map propagator. The following example uses the mysql driver. For PostgreSQL, use the postgres driver and semconv.DBSystemNamePostgreSQL.
import (
    "github.com/XSAM/otelsql"
    semconv "go.opentelemetry.io/otel/semconv/v1.40.0"
)

db, err := otelsql.Open("mysql", dsn,
    otelsql.WithAttributes(semconv.DBSystemNameMySQL),
    otelsql.WithSQLCommenter(true),
)
Make sure the global propagator includes propagation.TraceContext{}, for example with otel.SetTextMapPropagator(propagation.TraceContext{}).
Java
The OpenTelemetry Java agent (2.21.0 or later) includes an experimental JDBC sqlcommenter option. Enable it with a system property or environment variable:
-Dotel.instrumentation.jdbc.experimental.sqlcommenter.enabled=true
# or via environment variable:
export OTEL_INSTRUMENTATION_JDBC_EXPERIMENTAL_SQLCOMMENTER_ENABLED=true
If you are on an older agent version or prefer to add the comment in your data access layer, use a helper that reads the current span, URL-encodes the value per the sqlcommenter specification, and appends the traceparent to the SQL string before passing it to JDBC:
import io.opentelemetry.api.trace.Span;
import io.opentelemetry.api.trace.SpanContext;
import java.net.URLEncoder;
import java.nio.charset.StandardCharsets;

public static String annotate(String sql) {
    SpanContext ctx = Span.current().getSpanContext();
    if (!ctx.isValid()) {
        return sql;
    }
    String traceparent = "00-" + ctx.getTraceId() + "-" + ctx.getSpanId() + "-" + ctx.getTraceFlags().asHex();
    String encoded = URLEncoder.encode(traceparent, StandardCharsets.UTF_8);
    return sql + " /*traceparent='" + encoded + "'*/";
}
Values in the comment must be URL-encoded and single-quoted, as the sqlcommenter specification requires. The sqlcommenter project also publishes Hibernate and Spring integrations for Java.
Ruby
The OpenTelemetry mysql2 (>= 0.34.1), pg (>= 0.37.1), and trilogy (>= 0.69.1) instrumentation gems support sqlcommenter propagation natively. Set propagator: 'tracecontext' when configuring the SDK:
require 'mysql2'
require 'pg'

OpenTelemetry::SDK.configure do |c|
  c.use 'OpenTelemetry::Instrumentation::Mysql2', propagator: 'tracecontext'
  c.use 'OpenTelemetry::Instrumentation::PG', propagator: 'tracecontext'
end
In Ruby on Rails, Active Record executes queries through those underlying driver gems (pg, mysql2, or trilogy). If your Rails initializer uses use_all, pass propagator: 'tracecontext' for your database adapter in config/initializers/opentelemetry.rb:
OpenTelemetry::SDK.configure do |c|
  c.use_all(
    'OpenTelemetry::Instrumentation::Mysql2' => { propagator: 'tracecontext' },
    'OpenTelemetry::Instrumentation::PG' => { propagator: 'tracecontext' },
    'OpenTelemetry::Instrumentation::Trilogy' => { propagator: 'tracecontext' },
  )
end
Alternatively, in Rails 7+ you can use Active Record’s built-in QueryLogs (which uses the sqlcommenter format by default in Rails 7.1+) and add a traceparent tag in config/application.rb:
config.active_record.query_log_tags_enabled = true
config.active_record.query_log_tags = [
  :application,
  :controller,
  :action,
  {
    traceparent: -> {
      ctx = ::OpenTelemetry::Trace.current_span.context
      next unless ctx.valid?
      flags = format("%02x", ctx.trace_flags.sampled? ? 1 : 0)
      "00-#{ctx.hex_trace_id}-#{ctx.hex_span_id}-#{flags}"
    }
  }
]
Require the mysql2 or pg gem before your ORM (such as Sequel) loads it so the OpenTelemetry patches apply.
Considerations
Some application and database settings affect whether the comment reaches Alloy intact and whether an exact match finds the sample.
- Which span ID the comment carries. Exact trace match keys on the trace ID and the span ID. The span ID in the comment is the span that was active when the comment was added. When the comment is added before the database client span opens, for example in a helper called at the query call site or an outer
database/sqlwrapper, the comment carries the parent span’s ID and the match resolves to the trace rather than to the database span. Instrumentations that add the comment from inside the database client span, such as the built-in Python, Node.js,otelsql(WithSQLCommenter), Java agent, and Ruby instrumentation options above, carry the database span’s ID. - Prepared statements. Server-side prepared statements (where the database parses the SQL once on
PREPAREand subsequentEXECUTEcalls only pass a statement ID and parameters, such as Node.jsmysql2’sexecute()or Go’sdb.PrepareContext()) do not carry a per-executiontraceparent: the comment is either skipped or fixed to the trace that originally prepared the statement. - Long statements. The database stores a limited length of statement text for each sample, and sqlcommenter appends
traceparentat the end. If a statement exceeds that limit, the comment is truncated. Refer to the MySQL troubleshooting guide and PostgreSQL troubleshooting guide to check and update the database engine settings correctly. - Span attribute sanitization. OpenTelemetry SDKs commonly sanitize or omit literals and comments in
db.query.text/db.statementon the span (for example, replacing quoted values with?). Database Observability normalizes span query text and readstraceparentfrom the database sample collected by Alloy, so span sanitization doesn’t affect trace linkage.
The fullstack-o11y-examples repository shows a working setup for each language.
Linking a query sample back to a trace
Database Observability shows View trace in Explore links directly on query sample tooltips. Selecting it opens Explore Traces with the trace ID and span ID from the sample’s traceparent.
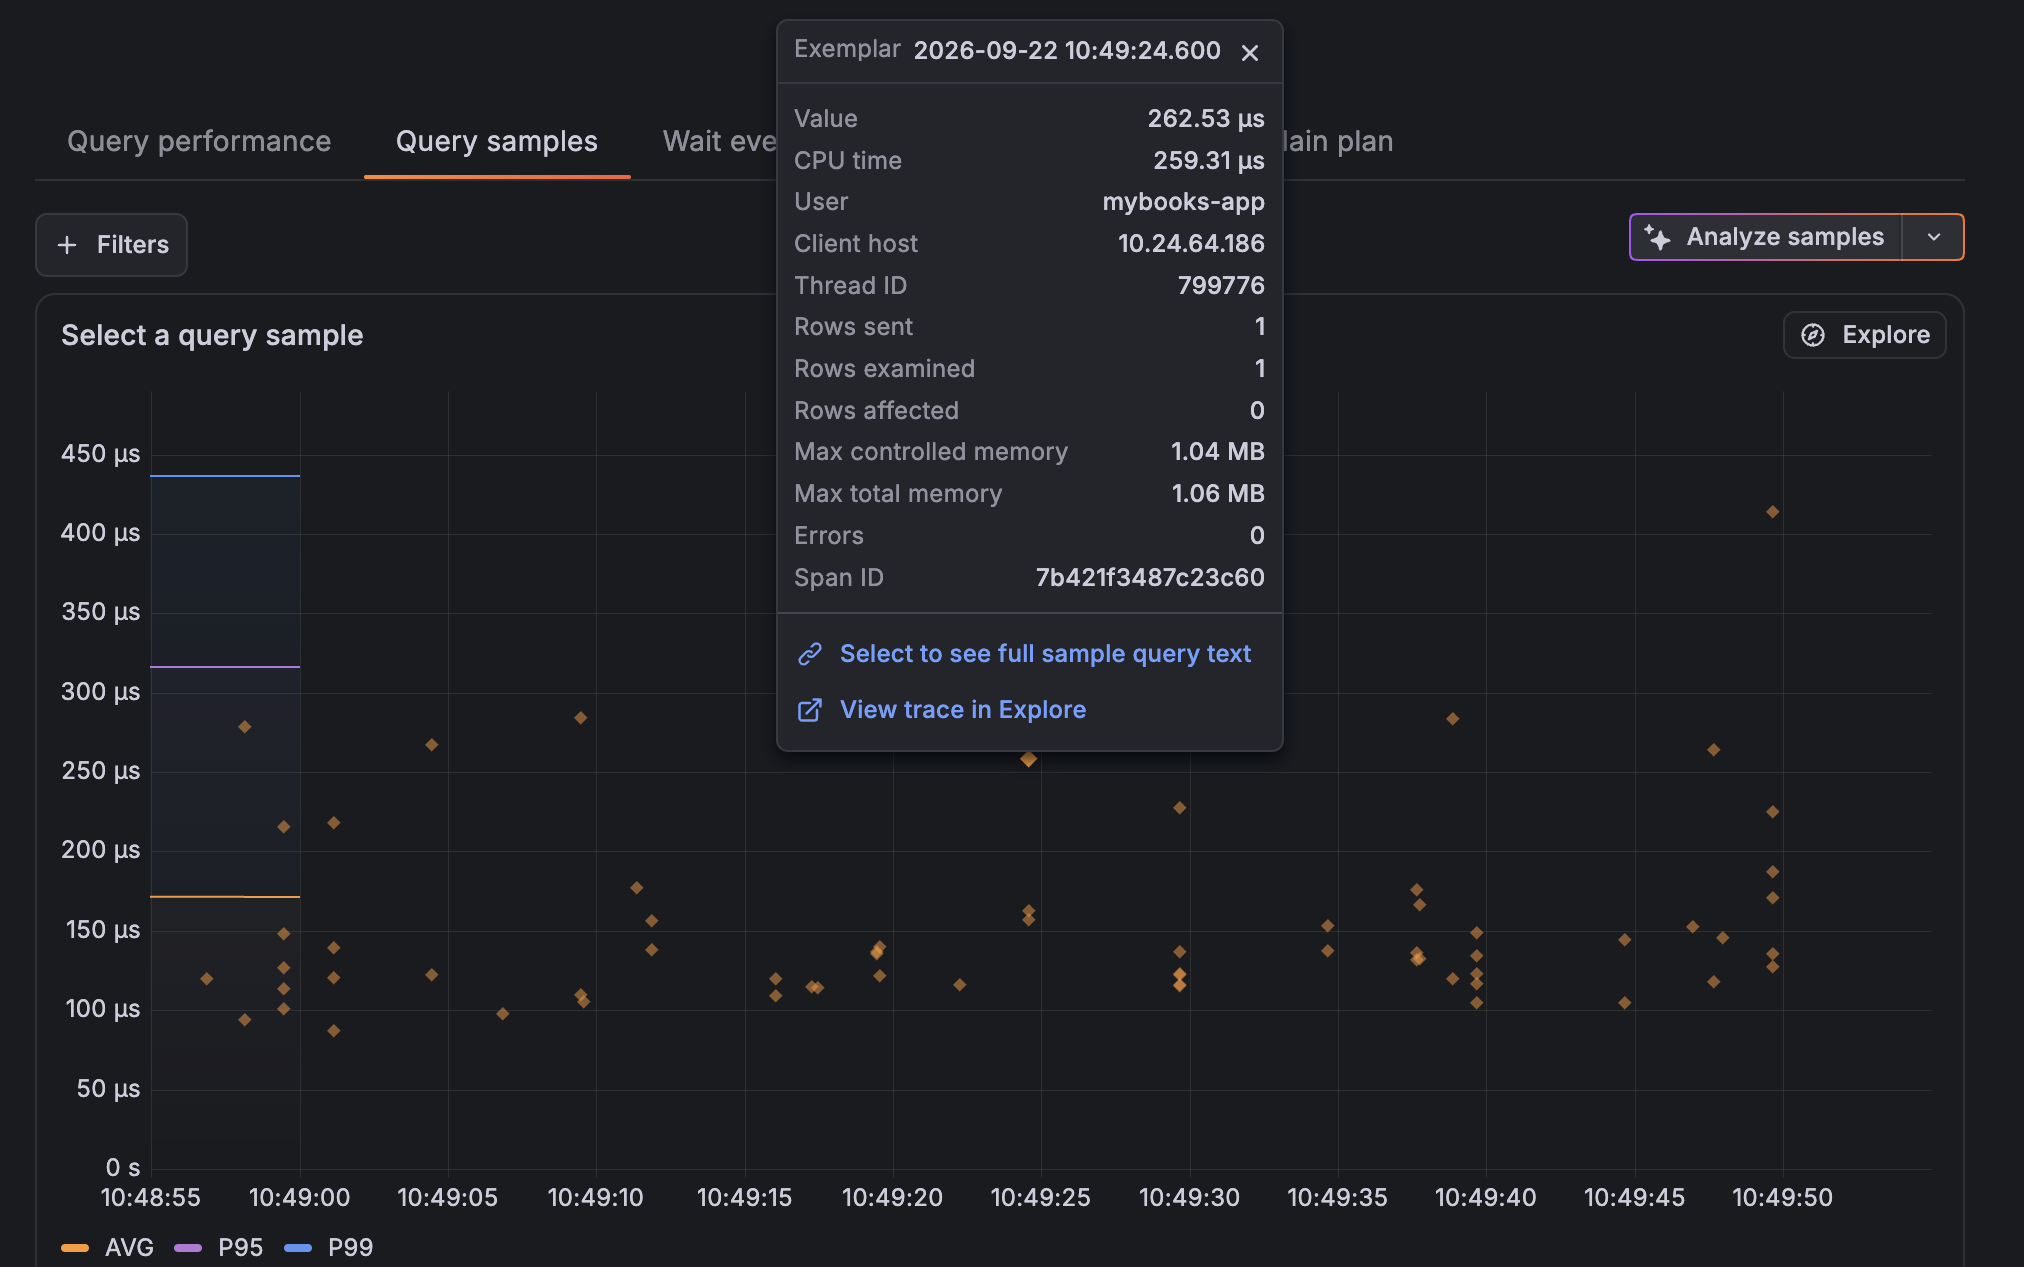
The link requires:
- a W3C
traceparentcomment appended to your SQL text with sqlcommenter. Refer to Enable sqlcommenter in your application. - Alloy 1.17.0 or later
On older versions of Alloy, when a query sample includes a traceparent, you can copy the trace ID from the sample and search for it in Explore or Traces Drilldown.
Troubleshoot trace matching
If selecting a link doesn’t take you to a specific query, use the checks below for the type of matching you expect.
If query text matching doesn’t find a query
Query text matching relies on the queries Database Observability has already collected. If a link sends you to Queries overview instead of a specific query, check the following:
- Confirm the query text is collected. Database Observability refreshes the queries based on the sampling rate configured in Alloy, so a query it hasn’t collected yet can’t be matched. Wait for the next collection and try again. To check whether a query is available for matching, query the logs under
op="query_association"in your logs data source and confirm your query text appears. - The text must match after normalization. Matching uses normalized query text, so unusual literals or formatting can prevent a match.
If exact matching doesn’t find a sample
Exact matching only succeeds if Alloy sampled the specific execution behind the span and captured its traceparent. Alloy samples running queries periodically rather than capturing every execution, so most executions are never sampled and exact matching remains best-effort even when sqlcommenter is configured correctly.
- Confirm the
traceparentis logged. In your logs data source, query the logs underop="query_sample"and confirm the log lines include atraceparentfield. If it’s missing, sqlcommenter isn’t appending thetraceparentor Alloy is below 1.17.0. A matching log line looks like this:
level="info" datname="shop" pid="1089" leader_pid="" user="shop-api" app="" client="203.0.113.10:54321" backend_type="client backend" state="idle" xid="0" xmin="0" xact_time="" query_time="4.294ms" queryid="5810693783667443671" traceparent="00-5bd66ef5095369c7b0d1f8f4bd33716a-c532cb4098ac3dd2-01"- Lower
collect_intervalwith care. Thequery_samplesblock has acollect_intervaloption that controls how often Alloy samples queries from the database. A shorter interval samples more executions and raises the chance that the one you selected was captured, but it cannot ensure every execution is captured from the database. Shorter intervals also increase telemetry volume and add load to your database, so lowercollect_intervalgradually and watch the impact. For broader coverage, rely on query text matching.
Use Adaptive Traces to keep query spans
If you use Adaptive Traces, you can choose to retain traces that contain database query spans. Retaining those traces keeps the trace available, so you can reliably match from a query sample back to its trace.
Configure an Adaptive Traces policy of type and. The policy retains traces only when a span has both a supported database system and query text:
{
  "and_sub_policy": [
    {
      "name": "db-system-check",
      "type": "ottl_condition",
      "ottl_condition": {
        "span": [
          "attributes[\"db.system.name\"] == \"mysql\" or attributes[\"db.system.name\"] == \"postgresql\" or attributes[\"db.system\"] == \"mysql\" or attributes[\"db.system\"] == \"postgresql\""
        ],
        "error_mode": "ignore"
      }
    },
    {
      "name": "has-query-text",
      "type": "ottl_condition",
      "ottl_condition": {
        "span": [
          "attributes[\"db.query.text\"] != nil or attributes[\"db.statement\"] != nil"
        ],
        "error_mode": "ignore"
      }
    }
  ]
}
Was this page helpful?
Related resources from Grafana Labs