
 Grafana Cloud
Platform
Cost Management and Billing
Analyze and reduce costs
Reduce costs
Logs costs
Fair use query costs
Manage fair use query costs
As explained in the Logs pricing documentation, Grafana Cloud Logs pricing includes a fair use query policy that allows you to query up to 100x your written logs volume each month at no additional cost. If you exceed the fair use query policy, Grafana Cloud bills you for each additional gigabyte you query that month.
Note
If you exceed the 100x fair use query policy, Grafana Cloud uses the following calculation for each stack:
logs billable queried gb = queried gb - (written gb * fair use query ratio)
Written log volume is the amount of gigabytes retained after samples are dropped by Adaptive Logs rules or ingestion failures due to misconfiguration.
Recommendations
To reduce log query costs, fix alert rules, write optimized queries, check query estimates before you run a search, and improve log label design.
Fix alert rules
Alert rule configuration issues are the most common cause of high log query usage. Use the following alert rule settings to reduce log query usage:
- Use instant queries instead of range queries for all rules. An instant query executes exactly one time and produces one data point for each series matched by your label selectors. Range queries are effectively instant queries executed multiple times. For more details, refer to the How to run faster Loki metric queries with more accurate results blog post.
- Match the query range to the evaluation interval. A rule that runs once per minute should have a query range of
1m. - Scope rules with multi-dimensional alerts instead of one rule per host, service, or endpoint. This avoids duplicate rules that each run their own query. For more information about scoping rules, refer to Best practices.
- Use short-window aggregations and a pending period to catch spikes, instead of increasing evaluation frequency.
- Prune rules regularly. Review alerts on a schedule and remove rules that never lead to action or that cover deprecated environments you don’t need to monitor. Use dashboards and Drilldown views for investigation, not alerts.
Write optimized queries
Log queries can search through a large amount of data. Use the following query optimizations to reduce log query usage:
- Query the shortest time range you need instead of defaulting to long ranges such as the last 30 days.
- Use specific label selectors to refine broad scans.
- Avoid wildcard-heavy filters and regular expressions that also result in broad scans.
- Use
|=and!=instead of|~and!~. - Apply line filters and other log pipeline stages early in the query, before more expensive parsers such as
json,logfmt,pattern, andregexp. - Use recording rules to calculate the results of frequently used, resource-intensive LogQL metric queries ahead of time, and query the resulting metrics instead of the log data. For more information, refer to Create recording rules.
- Be deliberate with Grafana Assistant and other AI tools that might scan large volumes of log data.
For more information, refer to Query best practices in the Loki documentation.
Check cost before and after performing queries
You can view query usage before you run a query. When you write queries in Explore, Grafana displays an estimate of how much data the query reads:

After you run queries, review query activity and usage details in the Loki Query Fair Usage dashboard in the GrafanaCloud dashboard folder. For more information, refer to the Determine the source of log query usage section.
Improve label and stream design
Follow these practices from Label best practices in the Loki documentation:
- Use static labels for items such as regions, clusters, servers, applications, namespaces, and environments.
- Use dynamic labels sparingly to prevent high cardinality. If you need dynamic labels, make sure they’re long-lived values that you use frequently in queries.
- Be aware of dynamic labels that client services and collectors apply. Avoid labels such as
requestId. You can use Loki filter expressions to find this information without a dedicated label.
Set log query limits
To help prevent expensive queries from increasing your query usage, configure Loki query limit policies. Query limit policies are attributes on access policies that cap how much data a single query can read. When a query exceeds the configured limit, Loki rejects the query before it runs and returns an error message that explains how to adjust the query, for example by adding more specific stream selectors or reducing the time range.
Use query limit policies to:
- Stop unintentionally broad queries, such as queries over long time ranges or with few stream selectors, from reading large volumes of data.
- Set different limits for different users or tools by applying limits to the access policies their tokens use.
- Keep query usage predictable so that you stay within the fair use query policy.
Loki doesn’t enforce query limit policies for Loki-managed or Grafana-managed alerts. To control query usage from alerting rules, refer to the Fix alert rules section.
Note
Loki query limit policies are in public preview. They’re off by default, so contact Grafana Support to enable them.
Create usage alerts
To find out about unexpected costs before your invoice arrives, set up alerts in the Cost Management and Billing app. For more information, refer to Create usage alerts. Usage alerts notify you through your Grafana Alerting contact points, such as email or Slack, when usage or costs approach thresholds you set.
To catch increases in log query costs, create a cost alert for Global Spend, with alert levels at percentages of your planned monthly budget, such as 50%, 70%, and 85%. For instructions, refer to Create usage and cost alerts.
When a Global Spend alert fires, check your query usage ratio, as described in the View log query usage section. If query usage caused the increase, find the queries responsible, as described in the Determine the source of log query usage section.
View log query usage
To view your current query usage ratio in the Cost Management and Billing app, complete the following steps:
- Sign in to your Grafana Cloud instance.
- Navigate to Cost Management and Billing.
- In the Products section, expand Logs.
- Scroll to the end of the Logs section to view the log query rate and query usage ratio.
Your query usage ratio is often higher early in the billing month and decreases as you ingest more logs over the rest of the month.
For more information about usage in the Cost Management and Billing app, refer to Monitor usage.
Determine the source of log query usage
Use the Loki Query Fair Usage dashboard to find the queries that contribute most to your log query usage.
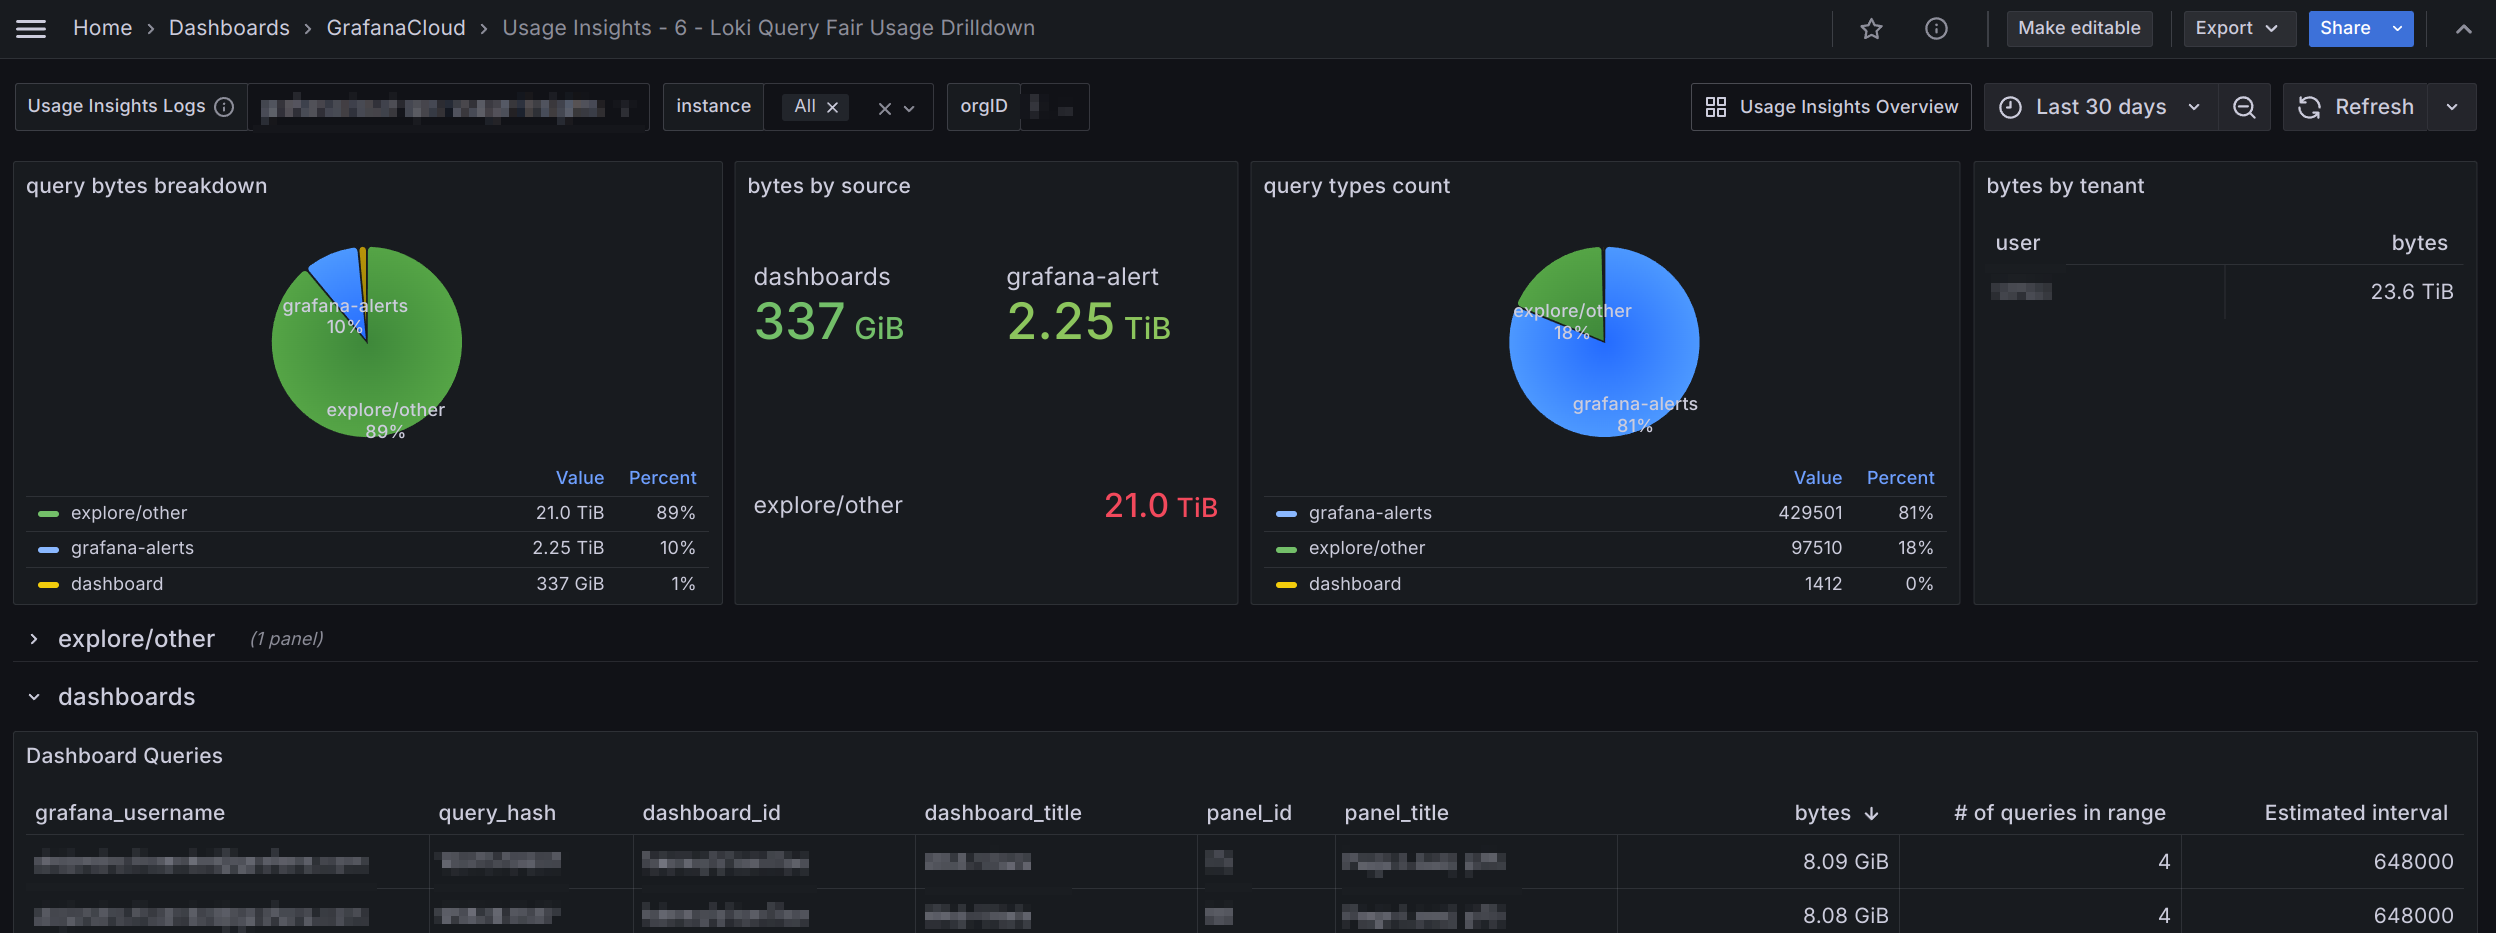
Grafana Cloud automatically provisions the dashboard in the GrafanaCloud dashboard folder. The dashboard shows a breakdown of query type, source, and volume, with rows that show more detail about the highest-volume queries for each type. The dashboard includes:
- The originating query
- The Grafana username that submitted the query, if relevant
- Rule and dashboard names
- Query size in bytes
- Query execution frequency
Definitions
The dashboard uses the following terms:
grafana-alert refers to rules managed within Grafana under the Alerting app found at Home > Alerts & IRM > Alerting. These rules can be alerts or recording rules. These are separate from the rules you upload to Loki with
cortextoolorlokitoolusing the Grafana Cloud APIs.Explore/other refers to a subset of queries executed against Loki that come from the Explore page. It doesn’t include those coming from the Grafana Logs Drilldown app.
It also includes queries that come from a non-Grafana frontend source such as
logcli.Explore queries likely have a grafana_username populated in the dashboard, queries from other sources don’t.
Estimated interval is the estimation of how frequently the query ran over the selected time period. It’s the number of times the query ran divided by the total time range.
Was this page helpful?
Related resources from Grafana Labs



