Menu
Choose a product
Scroll for more
Documentation
Grafana Cloud
Alerts and IRM
Alerting
Introduction
Alert rule evaluation
Alert rule state and health
Grafana Cloud
Enterprise
Open source
Alert rule state and health
Each alert rule can generate one or more alert instances—one alert instance for each series or dimension, as shown in the multi-dimensional alert example.
Each alert instance of the same alert rule represents a different target and can be in a different state; for example, one alert instance may be Normal while another is Alerting.

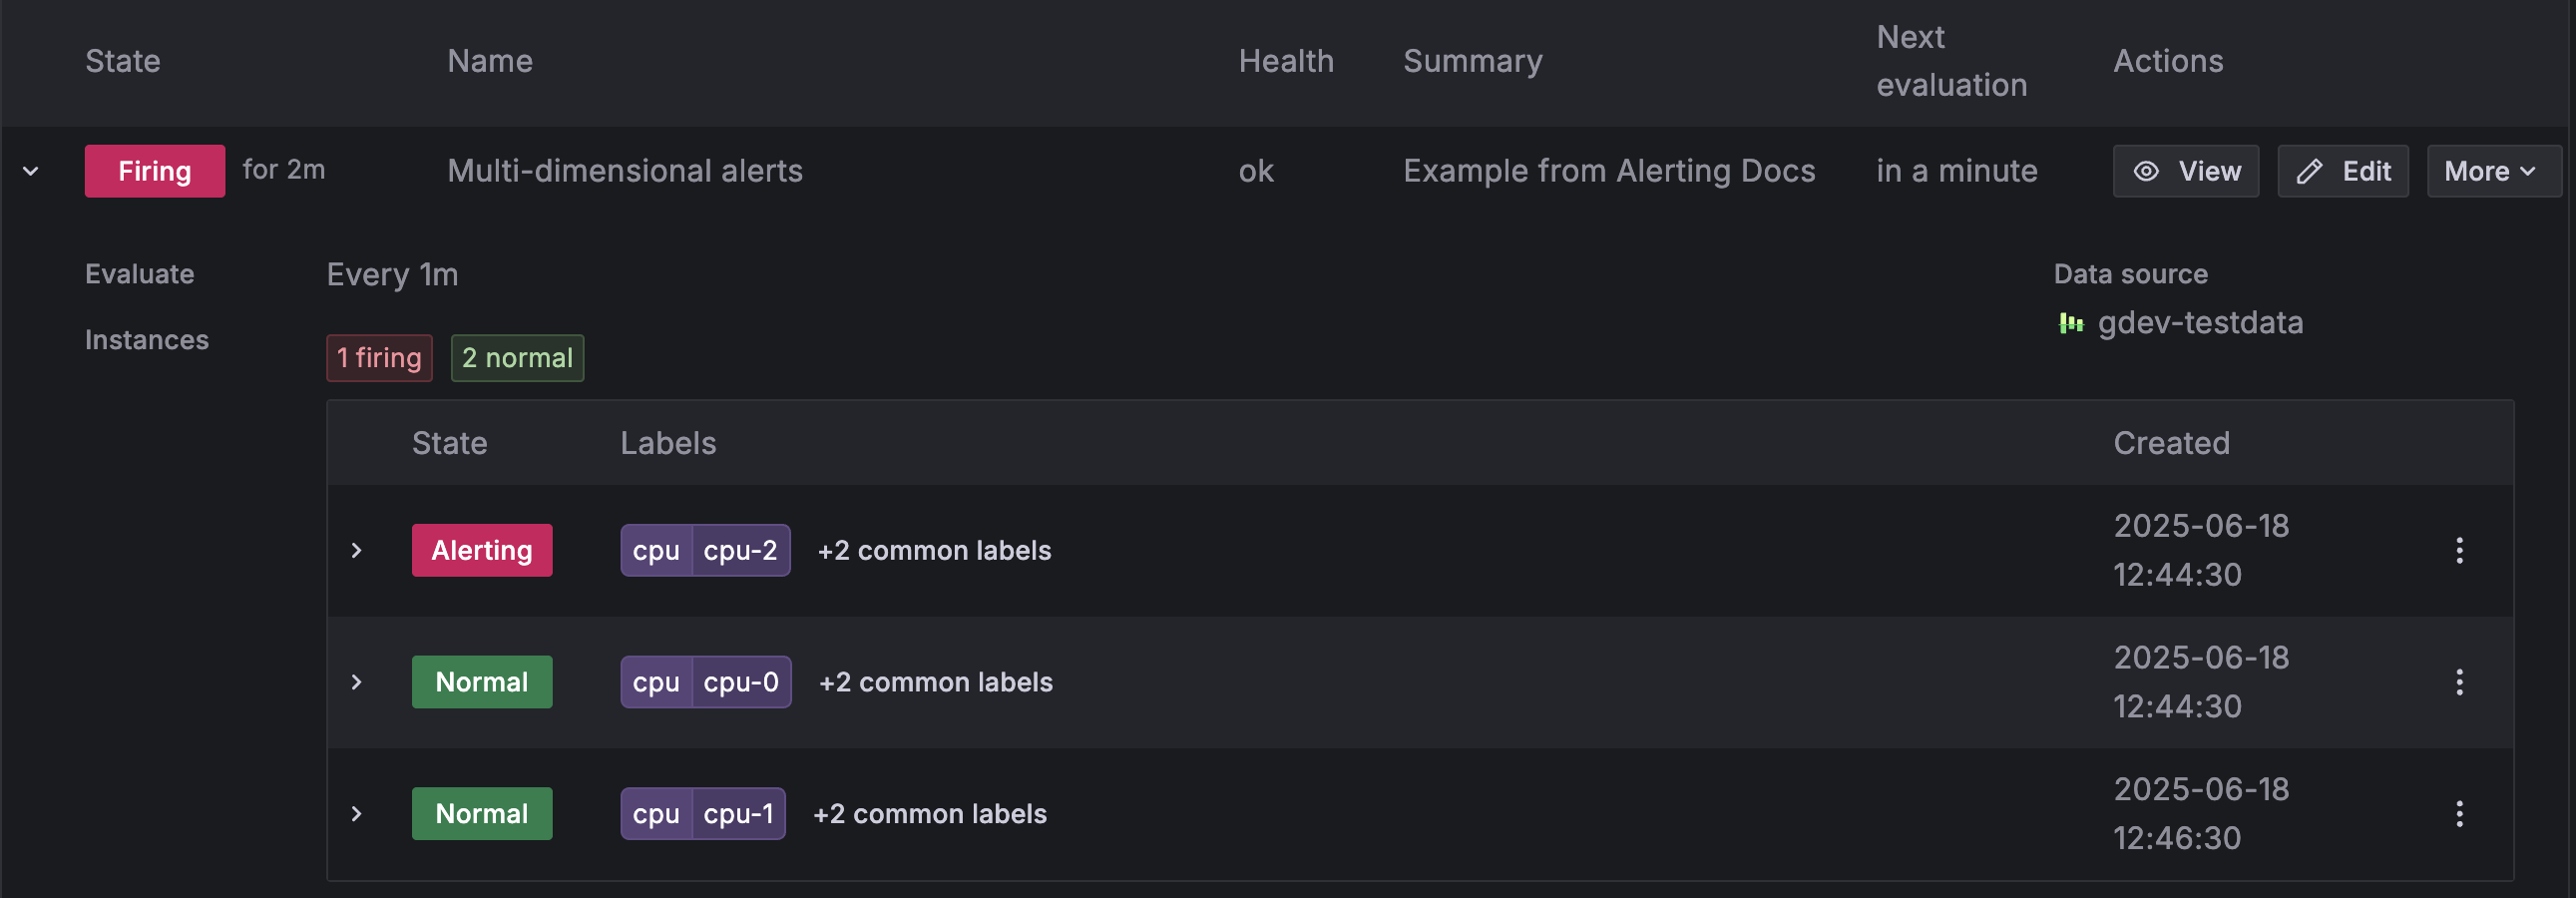
The alert rule state and alert rule health are determined by the state of the alert instances.
Alert rule states
An alert rule can be in either of the following states:
| State | Description |
|---|---|
| Normal | None of the alert instances returned by the evaluation engine is in a Pending or Alerting state. |
| Pending | At least one alert instances returned by the evaluation engine is Pending. |
| Firing | At least one alert instances returned by the evaluation engine is Alerting. |
Alert rule health
An alert rule can have one of the following health statuses:
| State | Description |
|---|---|
| Ok | No error when evaluating the alert rule. |
| Error | An error occurred when evaluating the alert rule. |
| No Data | The alert rule query returns no data. |
| {status}, KeepLast | The rule would have received another status but was configured to keep the last state of the alert rule. |
Was this page helpful?
Related resources from Grafana Labs
Additional helpful documentation, links, and articles:
Video

Getting started with managing your metrics, logs, and traces using Grafana
In this webinar, we’ll demo how to get started using the LGTM Stack: Loki for logs, Grafana for visualization, Tempo for traces, and Mimir for metrics.
Video

Intro to Kubernetes monitoring in Grafana Cloud
In this webinar you’ll learn how Grafana offers developers and SREs a simple and quick-to-value solution for monitoring their Kubernetes infrastructure.
Video

Building advanced Grafana dashboards
In this webinar, we’ll demo how to build and format Grafana dashboards.