Configure CloudWatch metric streams
With Grafana Cloud Observability Amazon CloudWatch metric streams, you can push CloudWatch metrics using Amazon Data Firehose, providing real-time insights and scalability while simplifying configuration and reducing manual effort.
What gets created
The configuration process sets up the following components:
- Access policy token: A Grafana Cloud token with
metric:writepermissions - AWS IAM roles: Multiple roles that authorize communication among required AWS services and between AWS services and Grafana Cloud
- CloudWatch metric stream: Captures metrics from CloudWatch in real-time and puts them on a Data Firehose delivery stream
- Data Firehose delivery stream: Delivers batches of metrics to Grafana Cloud using an HTTP endpoint
- AWS resource metadata scrape job: Enriches metrics with additional metadata like resource ARNs and tags
Data flow
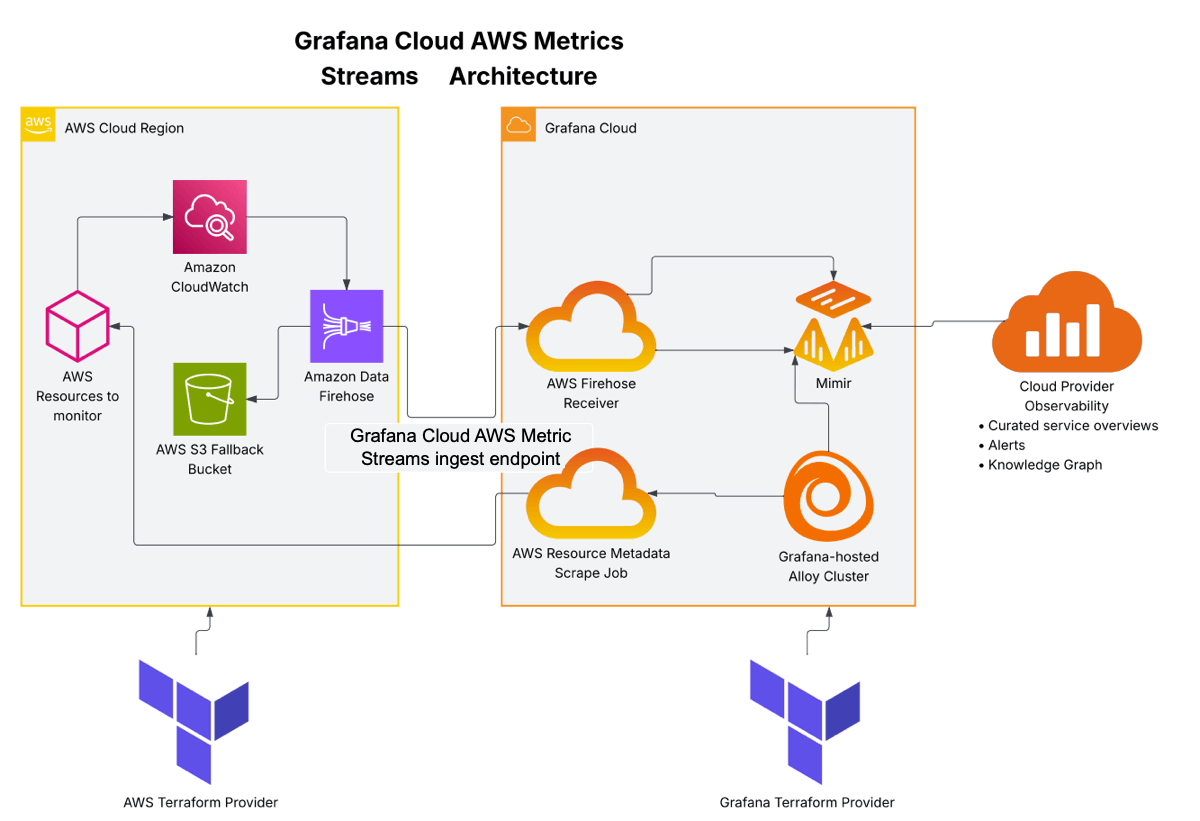
- Push raw service metrics
- Push filtered service metrics
- Backup on write failure
- Scrape tagged resource metadata as info metrics
- Collect scraped info metrics
- Write info metrics
- Read info metrics to enrich service metrics
- Write enriched service metrics
How it works
- CloudWatch continuously streams metrics to the metric stream
- The metric stream forwards data to Data Firehose in OpenTelemetry format
- Data Firehose batches and delivers metrics to your Grafana Cloud endpoint
- If delivery fails, Data Firehose backs up failed batches to S3
- The resource metadata scraper periodically fetches AWS resource tags and metadata
- Grafana Cloud combines metric stream data with resource metadata for rich context
Before you begin
Before configuring CloudWatch metric streams, ensure you have:
- AWS permissions: Sufficient access to your AWS account to manage IAM roles, CloudWatch metric streams, and Data Firehose delivery streams
- Grafana Cloud access: Sufficient access to your Grafana Cloud portal with permissions to create access policy tokens
- Configuration tool: Either AWS CloudFormation or Terraform installed and configured
- For CloudFormation: Access to the AWS account you want to monitor
- For Terraform: Terraform 1.0 or later installed locally
If you are not using either the provided CloudFormation template or Terraform sample code to configure Grafana Cloud AWS Metric Streams, you need the following:
Grafana Cloud AWS Metric Streams Ingest URL and Prometheus Username/Instance ID: The Grafana Cloud AWS Metric Streams Ingest URL is the URL you configure in the Data Firehose to send metrics to your Grafana Cloud instance. The Prometheus Username/Instance ID is used for the Data Firehose to authenticate when connecting to your Prometheus instance.
These values are generated in the provided CloudFormation template and Terraform sample code, but if you are using a different method such as creating AWS infrastructure in the AWS console, you need to obtain them.
Note
The metric stream and Data Firehose resources must be created in each AWS region you want to monitor. The resource metadata scrape job can query multiple regions from a single configuration.
Obtain the ingest URL and Username
The Grafana Cloud AWS Metric Streams Ingest URL and Prometheus Username/Instance ID are generated in the provided CloudFormation template and Terraform sample code, but if you are using a different method for configuring Grafana Cloud AWS Metric Streams such as creating AWS infrastructure in the AWS console, you need to obtain them.
The Grafana Cloud AWS Metric Streams Ingest URL is the URL you configure in the Data Firehose to send metrics to your Grafana Cloud instance. The Prometheus Username/Instance ID is used for the Data Firehose to authenticate when connecting to your Prometheus instance.
You can obtain them either in the UI in Grafana Cloud or programmatically using bash, jq, and the GCom API.
Obtain the ingest URL and Username in the Grafana Cloud UI
To obtain the Grafana Cloud AWS Metric Streams Ingest URL and Prometheus Username/Instance ID in the Grafana Cloud UI, perform the following steps:
- Navigate to your Grafana Cloud portal.
- Select your Grafana Cloud stack.
- Locate the Prometheus tile, and click Details.
- Copy and save the values for the Remote Write Endpoint and Username/Instance ID. The Username/Instance ID is used for the Data Firehose to authenticate when connecting to your Prometheus instance.
- Derive your Grafana Cloud AWS Metric Streams Ingest URL from your Prometheus Remote Write Endpoint using the following steps:
- Remove the
prometheus-prefix from the hostname to reveal your Mimir cell ID (for example,prod-<number>). - Insert the Mimir cell ID into the following Grafana Cloud Metric Streams URL template:
https://aws-metric-streams-<MIMIR_CELL_ID>.grafana.net/aws-metrics/api/v1/push- For example, if your Prometheus Remote Write Endpoint is
https://prometheus-prod-03-prod-us-central-0.grafana.net, then your Mimir cell ID isprod-03, and your Grafana Cloud AWS Metric Streams URL ishttps://aws-metric-streams-prod-03.grafana.net/aws-metrics/api/v1/push.
- For example, if your Prometheus Remote Write Endpoint is
- Remove the
Obtain the ingest URL and Username programatically
You need an access policy token with the stacks:read scope to obtain the Grafana Cloud AWS Metrics Streams Ingest URL and Prometheus Username/Instance ID programmatically.
To obtain the Grafana Cloud AWS Metric Streams Ingest URL and Prometheus Username/Instance ID programmatically, enter the following commands in bash:
STACK_INFO=$(curl -s -H "Authorization: Bearer $ACCESS_POLICY_TOKEN" \
  "https://grafana.com/api/instances/$STACK_SLUG")

read PROM_URL METRICS_USER <<< $(echo "$STACK_INFO" | jq -r '[.hmInstancePromUrl, (.hmInstancePromId | tostring)] | @tsv')
PROM_HOST=${PROM_URL#https://}
DOMAIN=${PROM_HOST#*.}
MIMIR_CELL_ID=$(echo "${PROM_HOST%%.*}" | grep -oE 'prod-[0-9]+')
echo "Grafana Cloud AWS Metric Streams Ingest URL: https://aws-metric-streams-${MIMIR_CELL_ID}.${DOMAIN}/aws-metrics/api/v1/push"
echo "Prometheus instance ID: ${METRICS_USER}"
Legacy Prometheus Read Write Endpoint hostnames
For some older Prometheus instances, the usual process for deriving the Grafana Cloud AWS Metric Streams URL does not work. In those instances use the following table to derive the Grafana Cloud AWS Metric Streams URL hostname:
Generate an access policy token
Both CloudFormation and Terraform configuration methods require an access policy token with metric:write permissions from Grafana Cloud.
To generate an access policy token:
- Open your Grafana Cloud portal.
- Expand Observability > Cloud provider in the main menu.
- Select AWS, the Configuration tab, and the CloudWatch metric streams card.
- Enter a name for the token and click Create token.
- Copy the token value and store it securely. You’ll need it in the next steps.
Warning
The token is only displayed once. If you lose it, you must create a new token.
If you are using Terraform, store this token value in your variables or secrets management system.
Choose your configuration method
You can configure CloudWatch metric streams using either CloudFormation or Terraform. Choose the method that best fits your infrastructure management approach.
CloudFormation
Best for:
- Quick setup with minimal configuration
- Teams primarily using AWS-native tools
- Simple deployments in a single AWS account, region, and namespace
Provides:
- Pre-built template with sensible defaults
- Quick deployment via AWS Console
- Automatic resource creation and dependency management
Tip
CloudFormation is the fastest way to get started if you’re setting up metric streams for the first time or in a single account.
Configure with CloudFormation →
Terraform
Best for:
- Infrastructure as Code (IaC) workflows
- Multi-account or multi-region deployments
- Integration with existing Terraform configurations
- Version control and automated deployments
Provides:
- Full customization of all resources
- Integration with Terraform state management
- Reusable modules for multiple deployments
- Integration with CI/CD pipelines
Tip
Choose Terraform if you manage your AWS infrastructure as code or need to deploy metric streams across multiple accounts or regions.


