Menu
Documentation Grafana Cloud
Visualize data
Simplified exploration
Profiles Drilldown
Access or install
Profile settings
Grafana Cloud
Visualize data
Simplified exploration
Profiles Drilldown
Access or install
Profile settings
Grafana Cloud
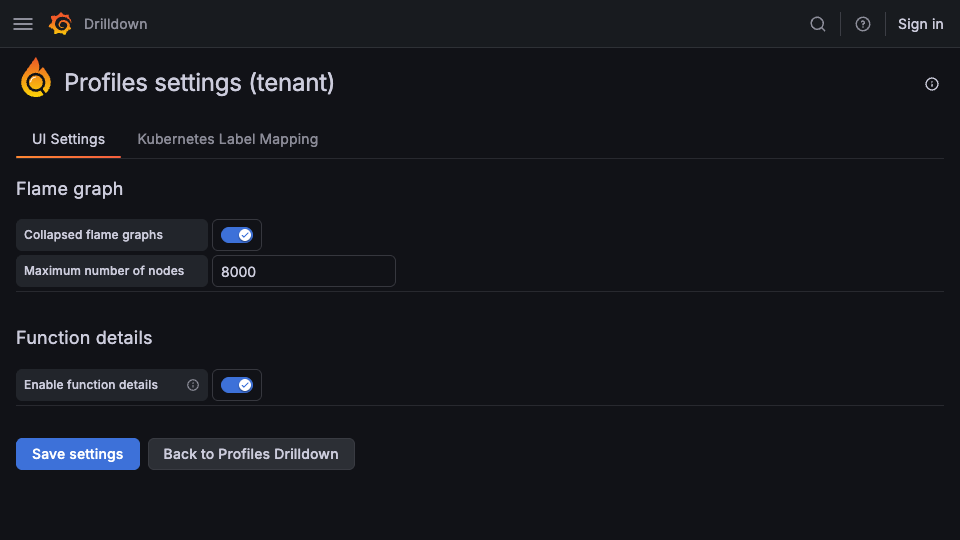
Profiles settings
The Profiles settings page lets you modify flame graph and function-details options used by Profiles Drilldown.
Modify settings
To change the settings for Profiles Drilldown:
- Sign in to your Grafana instance.
- Select Drilldown > Profiles in the left navigation.
- Select View/edit tenant settings in the top toolbar.
![Access tenant settings from the Profiles toolbar]()
- Change any options as desired.
- Select Save settings to preserve the changes.


