What's new from Grafana Labs Time range selector on all pages and in outlier detection
What's new from Grafana Labs
Time range selector on all pages and in outlier detection
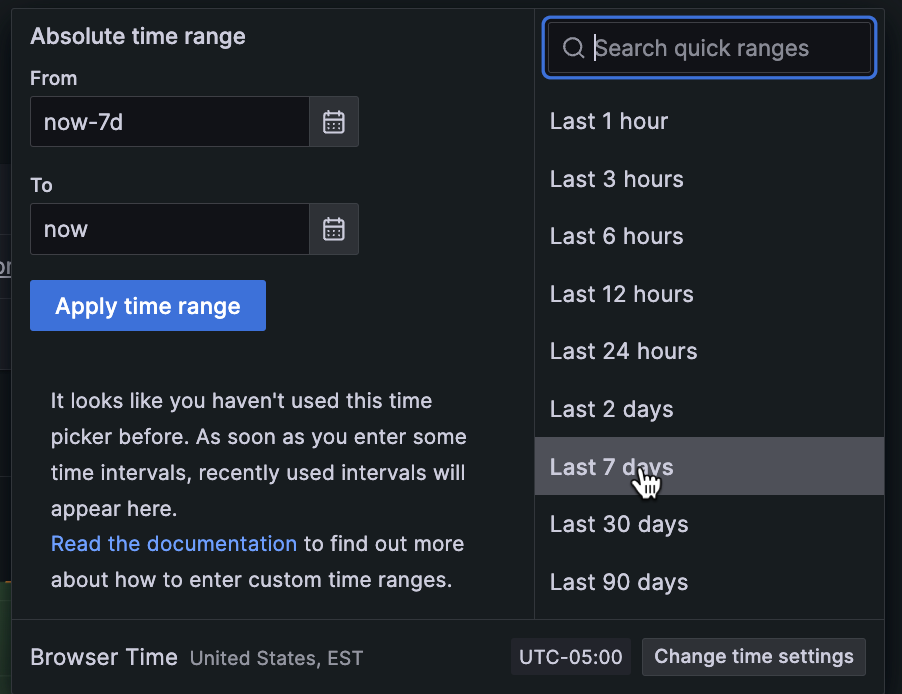
To aid in understanding historical data, a time range selector is available on every page of Kubernetes Monitoring where this function is appropriate. This selector is also available on the Workloads detail page, for detecting outlier CPU usage in the Pods. (Release 1.4.0)
Related What's new posts