No results.
There was an error with your request.
Grafana 12.4 is here — faster and easier data visualization, Git Sync for observability as code updates, and more.
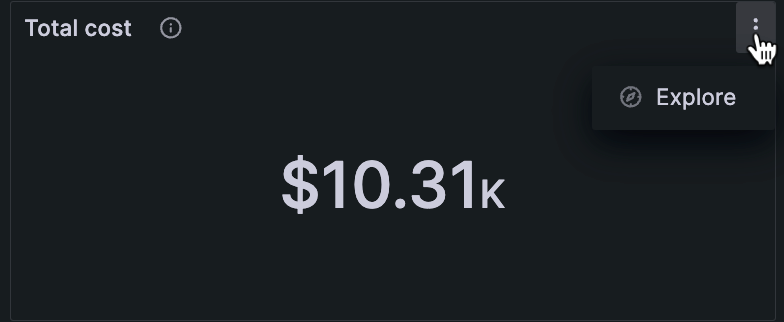
On any panel of the Cost page in Kubernetes Monitoring, click the Explore button.
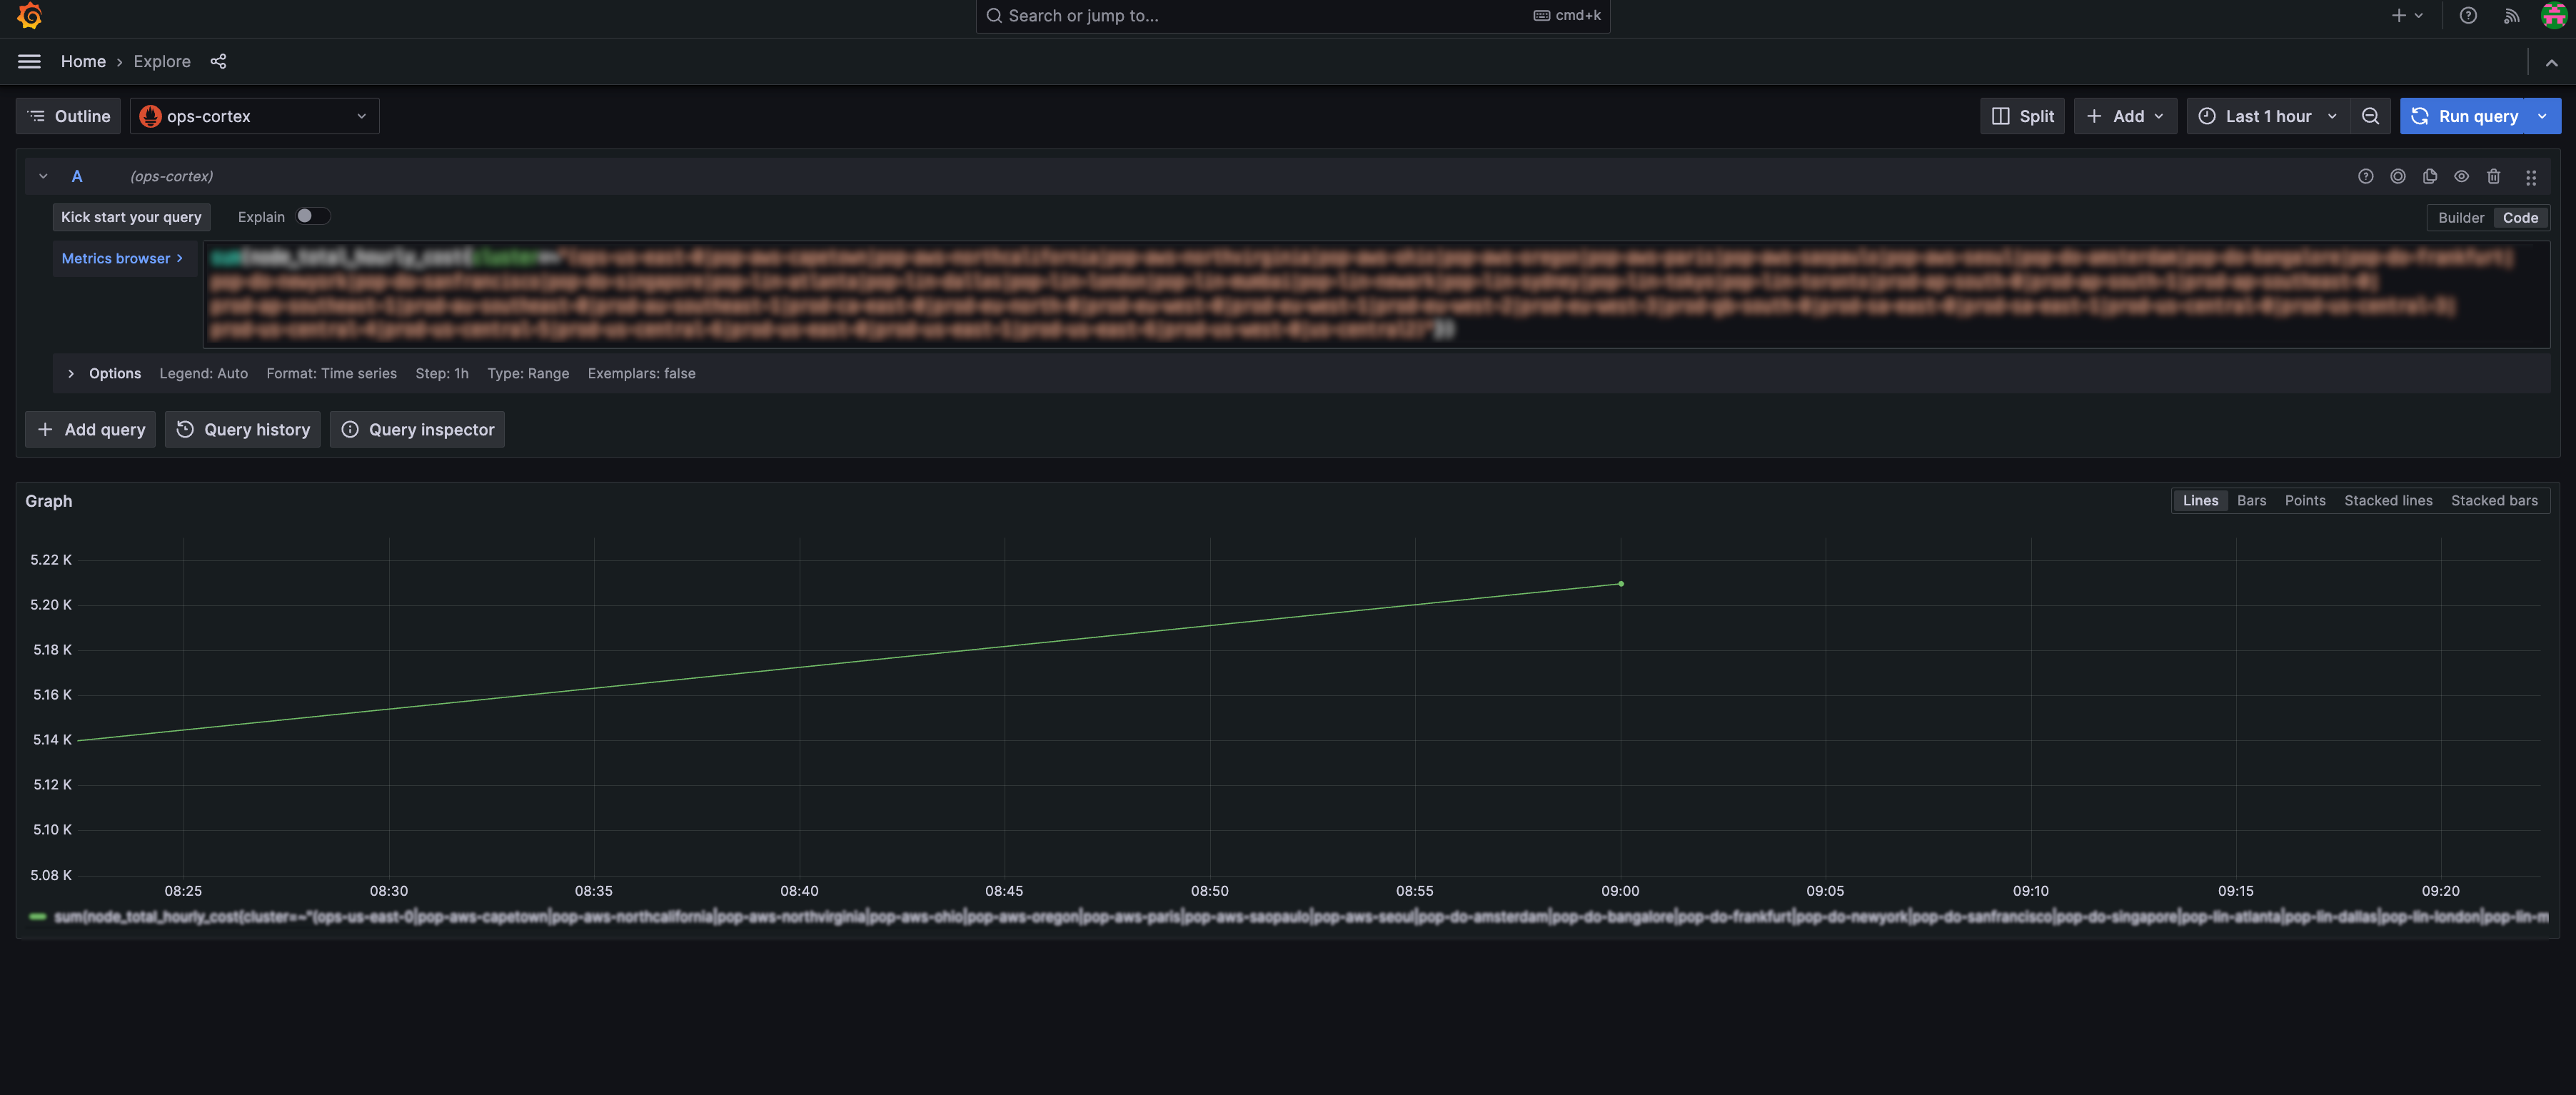
This launches the query details, where you can debug or create your own dashboard.
 Explore cost queries in Kubernetes Monitoring