What's new from Grafana Labs
Grafana Labs products, projects, and features can go through multiple release stages before becoming generally available. These stages in the release life cycle can present varying degrees of stability and support. For more information, refer to release life cycle for Grafana Labs.
Loading...
Area of interest:
Cloud availability:
Cloud editions:
Self-managed availability:
Self-managed editions:
No results found. Please adjust your filters or search criteria.
There was an error with your request.
Previously, Grafana automatically abbreviated large currency values like $1,235,667 to $1.24M or $555,558 into $555.6K. While this works well for most visualizations, financial data often requires exact values to be displayed.
Introducing LogicMonitor data source plugin.
The LogicMonitor Devices data source plugin enables you to query and visualize Device Instance Data, and to list Devices, Datasources, and Instances directly within Grafana. Available in public preview in Grafana Cloud and all supported versions of self-managed Grafana Enterprise.
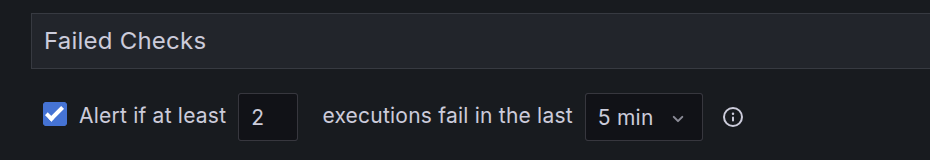
We’re excited to announce the public preview release of new alerting capabilities for Synthetic Monitoring. These new capabilities are available to all Grafana Cloud users.
The pipeline history feature in Fleet Management now offers you the chance to restore versions of existing configuration pipelines. From the History details page, choose a version and click Restore.
Pipelines in Grafana Fleet Management can now leverage the Alloy export block to share their components with other pipelines. With pipeline export injection, you can export components from one configuration pipeline and inject them into another using the syntax argument.pipeline_exports.value["PIPELINE_NAME"]["EXPORT_NAME"]. This powerful feature enables you to create dynamic configurations that adapt to each pipeline’s exported values, allowing for flexible and reusable pipeline configurations.
Sort and filter logs with ease in the Logs and Events tables. You can use multiple filters, including:
- Time period
- Component
- Cloud region
- Error level

Find any non-standard workloads using filters on the Workloads main page. Filtering includes:
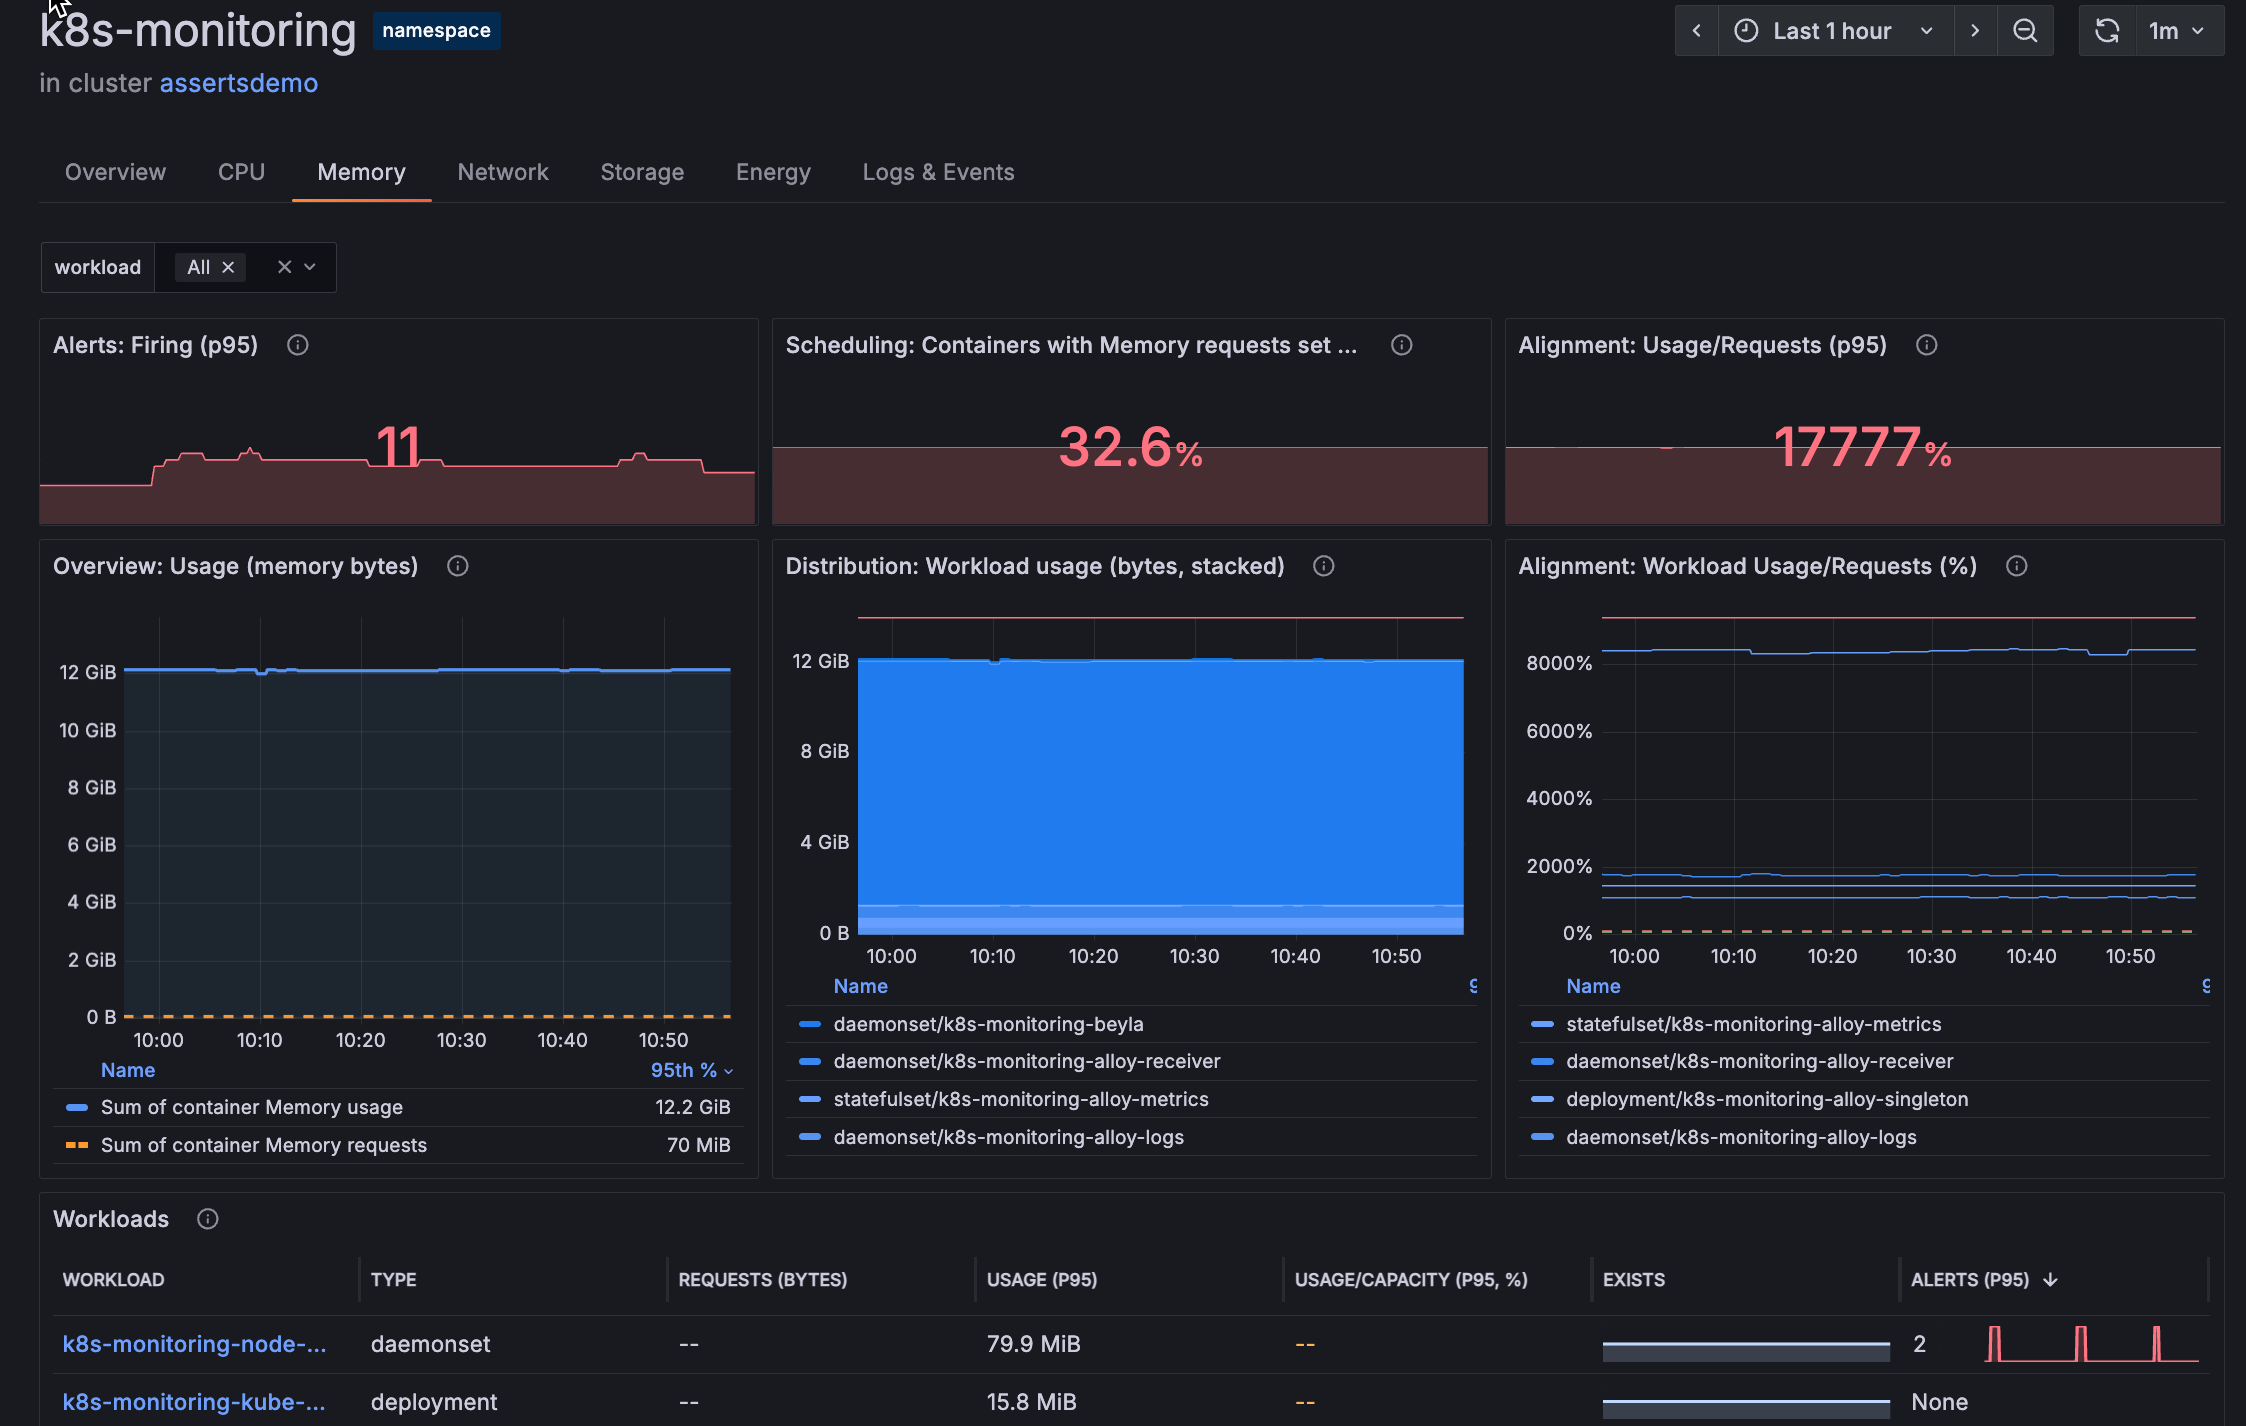
The memory tab and panels are accessible on any detail page beyond the container level. Now you can view memory usage in correlation with relevant data points, as shown in the screen capture of a namespace.
We recently added support for importing data source-managed rules through the alerting UI. However, users couldn’t import their existing Prometheus rules when no ruler was available.
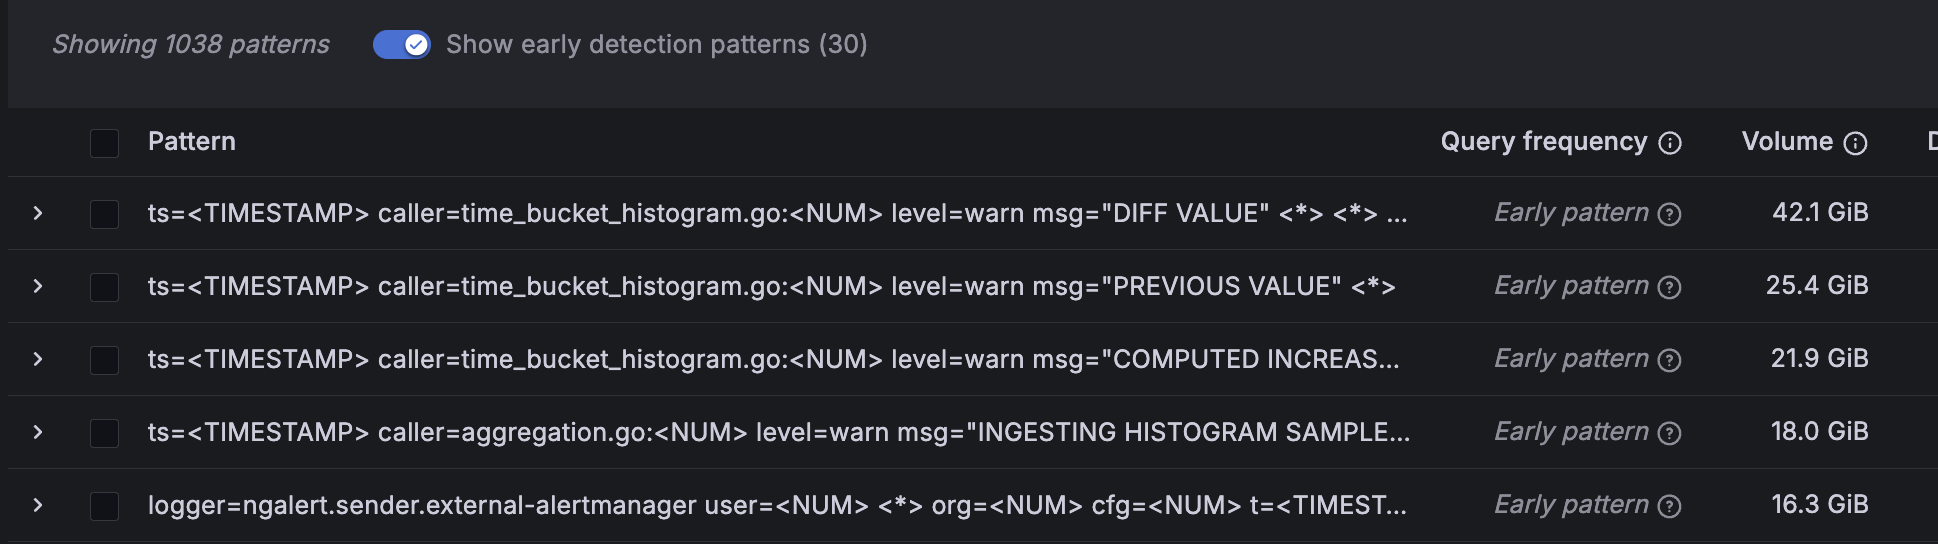
With early detection patterns, Adaptive Logs now shows log patterns without waiting to see how often they are queried. This feature allows you to proactively detect and filter out wasteful logs, ensuring only the most valuable telemetry is ever shipped to Grafana Cloud.
We’ve updated the main navigation in Grafana Cloud to bring all observability tools together under a single menu called Observability. You’ll now find App Observability, Frontend Observability, Kubernetes Monitoring, Infrastructure Monitoring, Cloud Provider Observability, and more grouped in one place.
We’re excited to introduce SLO Reports—a powerful new feature in Grafana SLO that enables users to report on multiple service level objectives (SLOs) on a weekly or monthly basis.
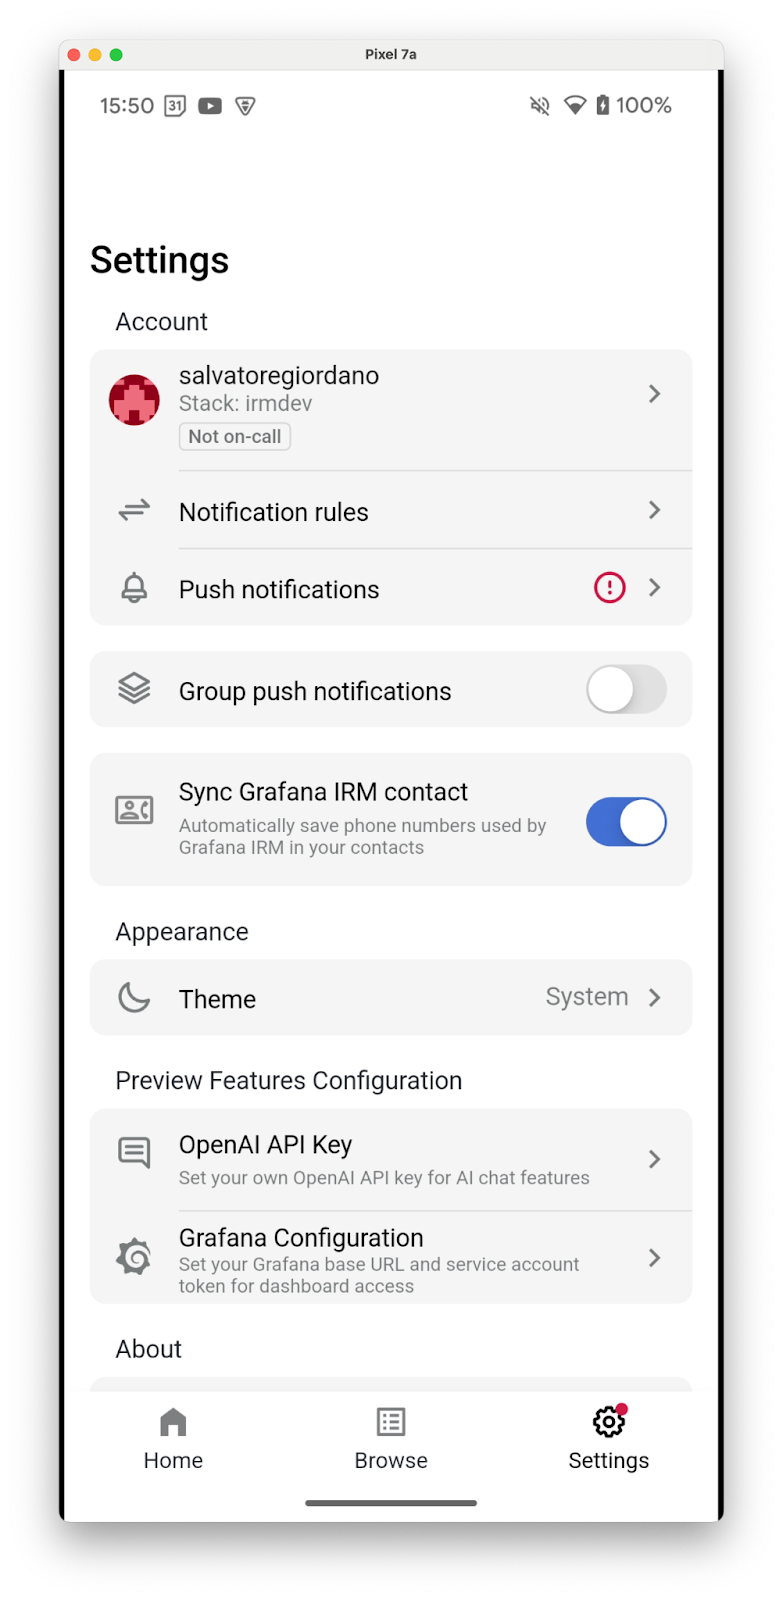
You can now sync Grafana IRM’s phone numbers to your mobile contacts. This helps you recognize IRM calls and allows you to bypass Do Not Disturb (DnD) for urgent alerts.
Kubernetes Monitoring offers CPU tabs with insightful panels on every detail page beyond the container page to provide you with quicker troubleshooting and better resource planning. You can gain deeper visibility from cluster to pod with utilization efficiency graphs and CPU distribution analysis.
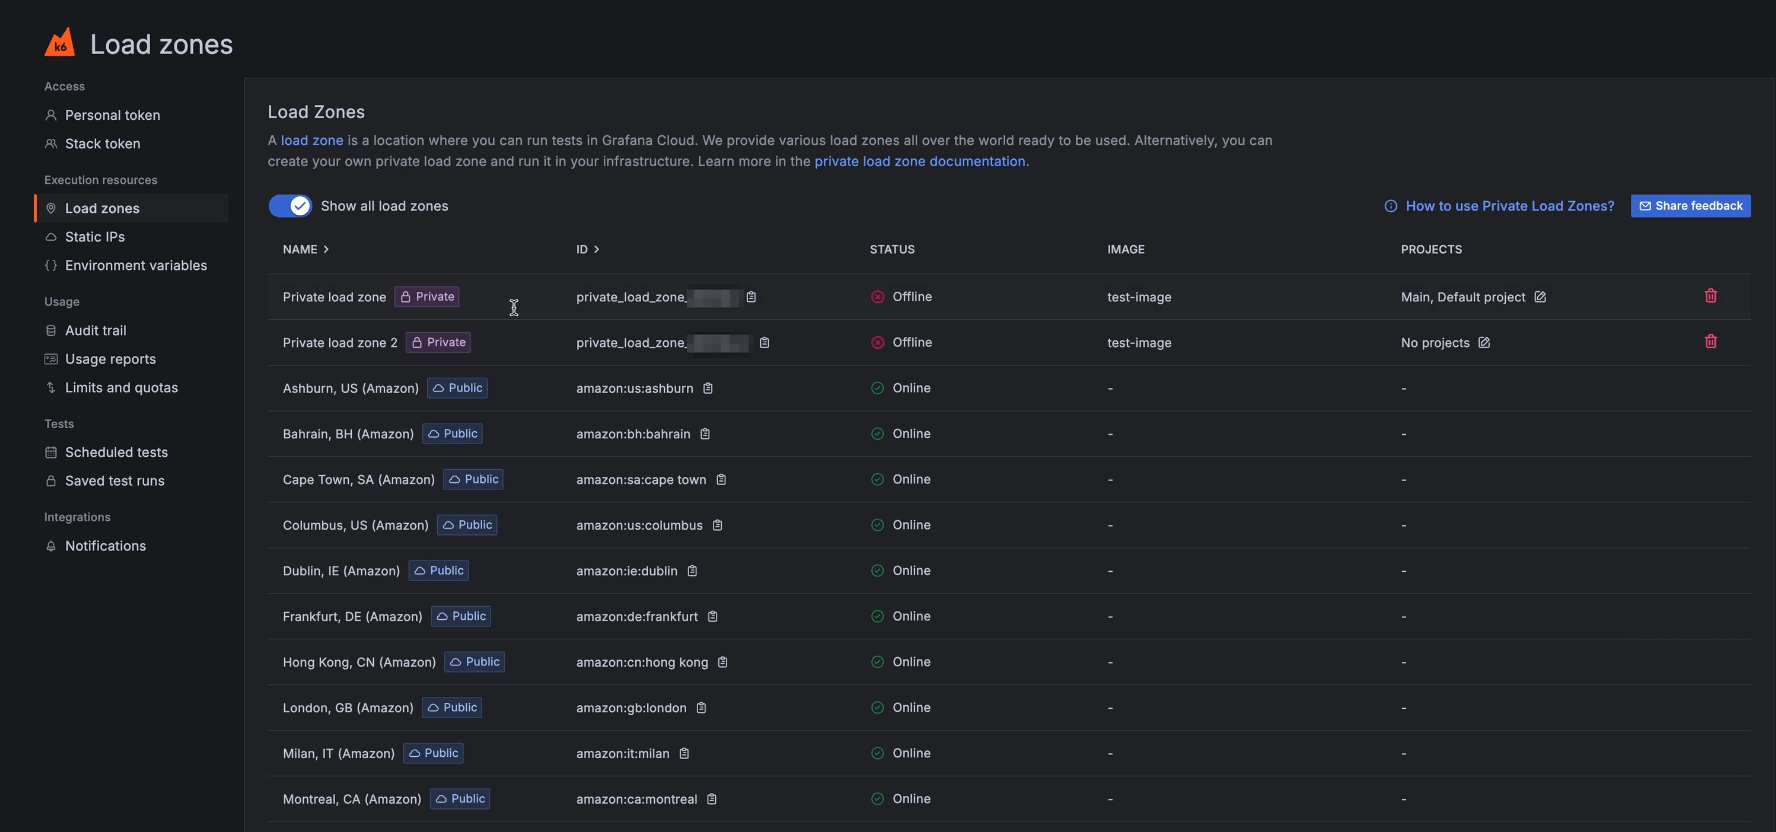
You can now restrict Private Load Zones (PLZs) in Grafana Cloud k6 to be used by a limited set of projects.
This feature lets you assign projects to a PLZ so that only tests inside of that project can be run on a specific PLZ.
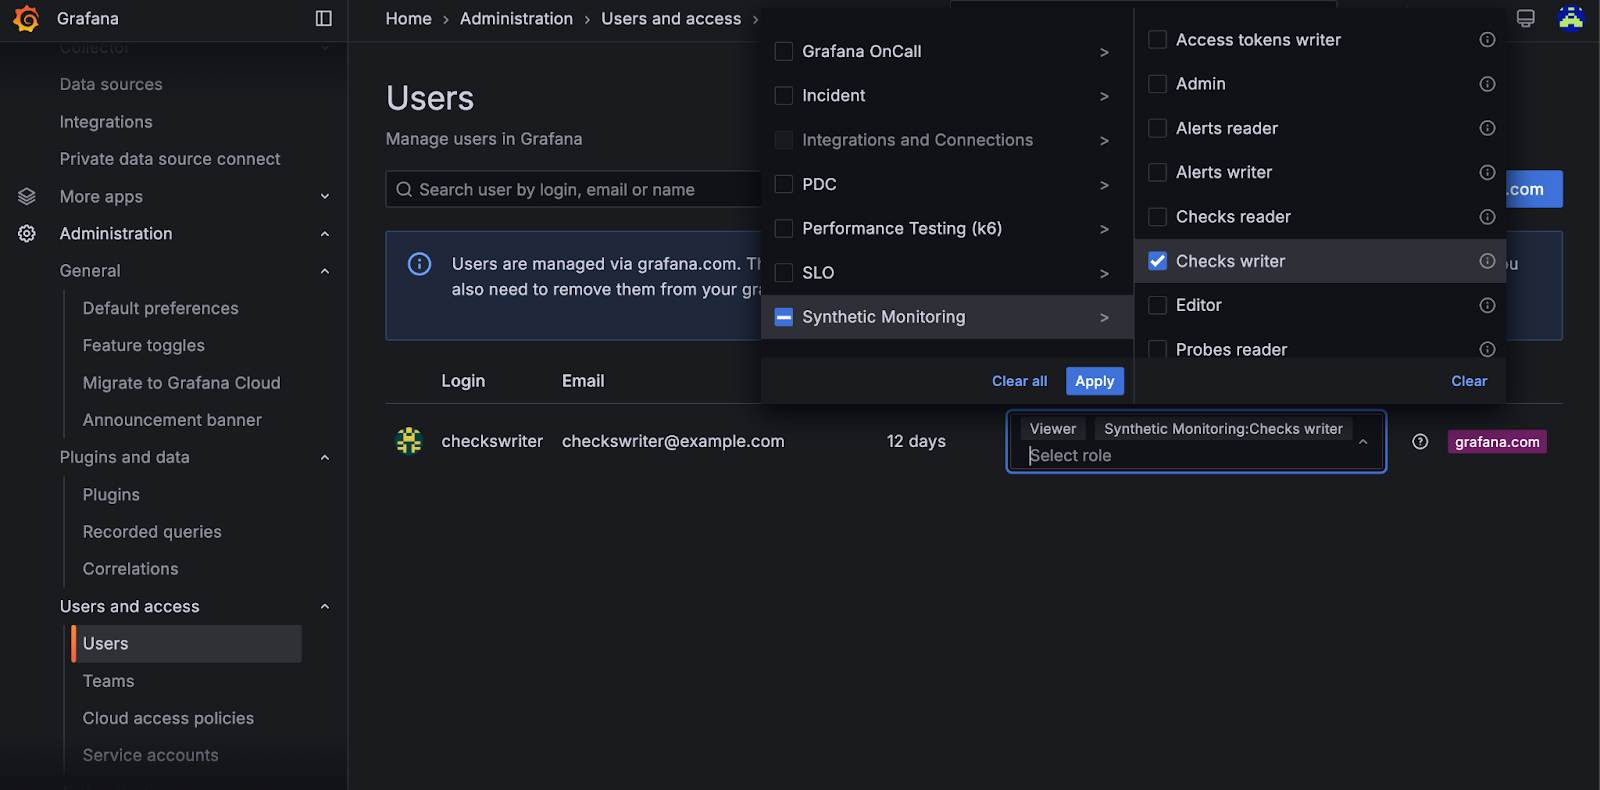
We’re excited to announce that Role-Based Access Control (RBAC) for Synthetic Monitoring is now generally available! This gives you the ability to fine-tune access and permissions within Synthetic Monitoring, offering greater control over who can access specific features.