Google Cloud Platform observability
Google Cloud Platform (GCP) observability allows you to monitor GCP metrics and view GCP logs.
GCP Metrics
Grafana Alloy sends metrics from Cloud Monitoring to Grafana Cloud. Alloy uses its embedded stackdriver-exporter to export metrics from Cloud Monitoring and then send them to Grafana Cloud.

To get GCP Metrics running, refer to Configure GCP Metrics.
Preconfigured dashboards
Preconfigured dashboards are out-of-the-box visualizations available in Grafana Cloud for popular Google Cloud services.
Cloud Provider Observability provides preconfigured dashboards for the following GCP services. Click the link to see details for the metrics provided for these services.
- AlloyDB for PostgreSQL: AlloyDB
- Bigtable: Cloud Bigtable
- Cloud Run: Cloud Run
- Cloud SQL: Cloud SQL
- Compute Engine: Compute Engine
- Cloud Load Balancing: Load Balancing
- Pub/Sub: Pub/Sub
- Cloud Storage: Storage (GCS)
- Virtual Private Cloud: VPC networks
Refine dashboard data
You can use the filters on any dashboard to refine your data. Filters are appropriate for each dashboard, and may include:
- Data source
- Job
- Project ID
- Instance
- Database ID
- Bucket name
- Country
- Backend target
- Subscription ID

Additionally, use the time range selector to change time period of your data.

Install GCP preconfigured dashboards and alerts
To install and view preconfigured dashboards and alerts:
- After you configure metrics, click the Configuration tab.
- Scroll down to the Dashboards and Alerts Installation section and click Install dashboards and alerts.
- Click the Services tab.
- Use the Service or Source filters to help you find the source or service you want to see.
- Optionally, click the Services with firing alerts checkbox to limit the services displayed to only those with firing alerts.
- Locate the specific service in the list, and click the name of the service in the Service column of the table to open the preconfigured dashboard for that service. If a Service’s name is not a link it means there is not a preconfigured dashboard for that service. To add a link to the Service’s name for a dashboard, refer to Dashboards and views settings.
- Optionally, click the Configure button to add a dashboard to the Service name.
- Optionally, click the Explore button to view links for custom dashboards, drilldown metrics, or to explore metrics. Refer to Dashboards and views settings for more information on adding custom dashboards.
View predictions
For the preconfigured dashboards that include drilldown information for specific instances, Cloud Provider Observability includes machine learning predictions. Predictions can help you ensure resources are available during spikes in usage, as well as help you decrease the amount of unused resources due to over provisioning. To use prediction tools, first enable LLM features for your Grafana instance.
You can view the prediction model for various metrics by clicking the Predict button in the top right corner of the panel.
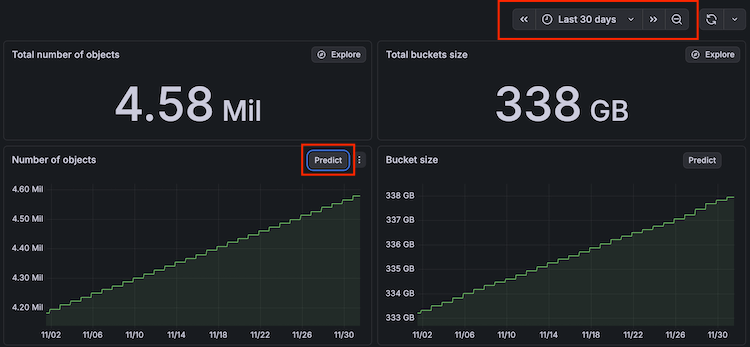
Use the time range filter to adjust the time range to show more advanced predictions. The time range you select must be at least two hours to use the prediction tool.
For more information on the terminology included and how machine learning works in the prediction graph, refer to the Query Metrics page in the AI and machine learning documentation.
Access Database Observability
For preconfigured dashboards that include drilldown information for GCP Cloud SQL instances, Cloud Provider Observability integrates with Database Observability.
You can move between infrastructure metrics on a cloud database instance and query-level performance in Database Observability.
Note
This integration requires configuring the
cloud_providerblock in Grafana Alloy. Refer to Add cloud provider integrations for setup instructions.
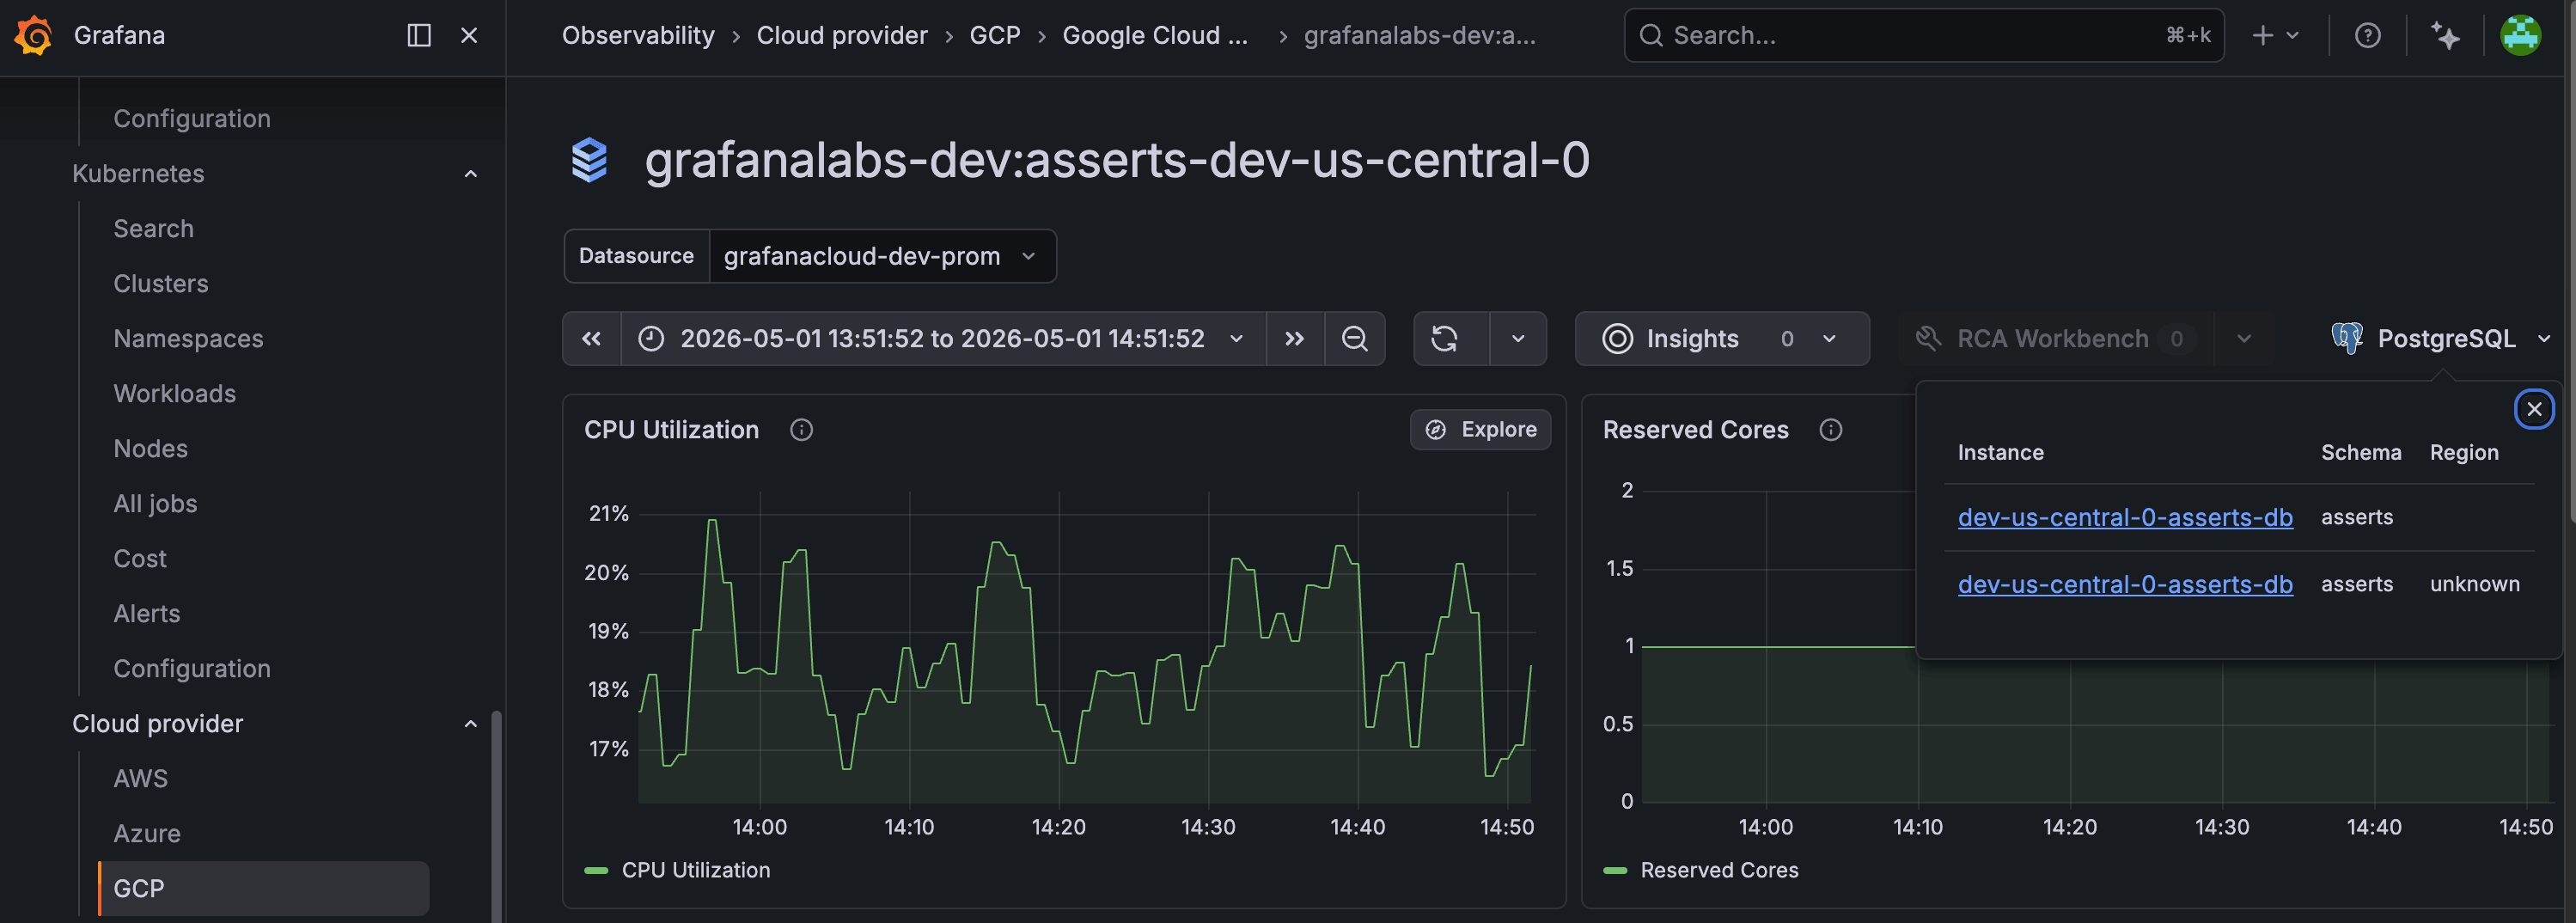
To navigate to Database Observability from a cloud database instance page in Cloud Provider Observability:
- On the instance page, click the MySQL or PostgreSQL dropdown in the upper right.
- Select a database instance from the list to open Queries Overview in Database Observability, filtered to that instance and schema.
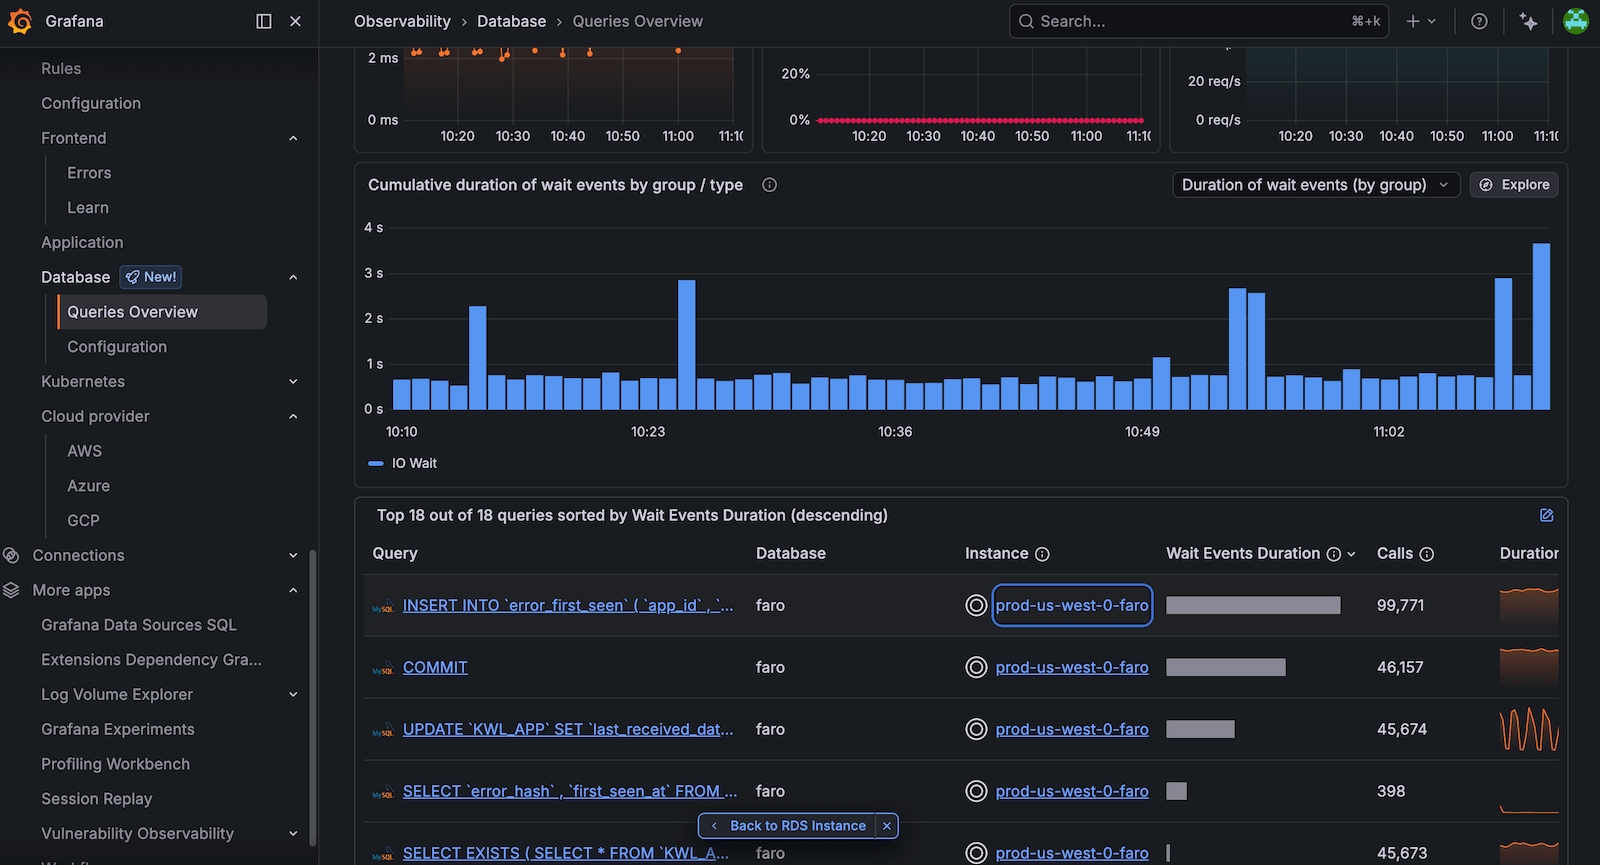
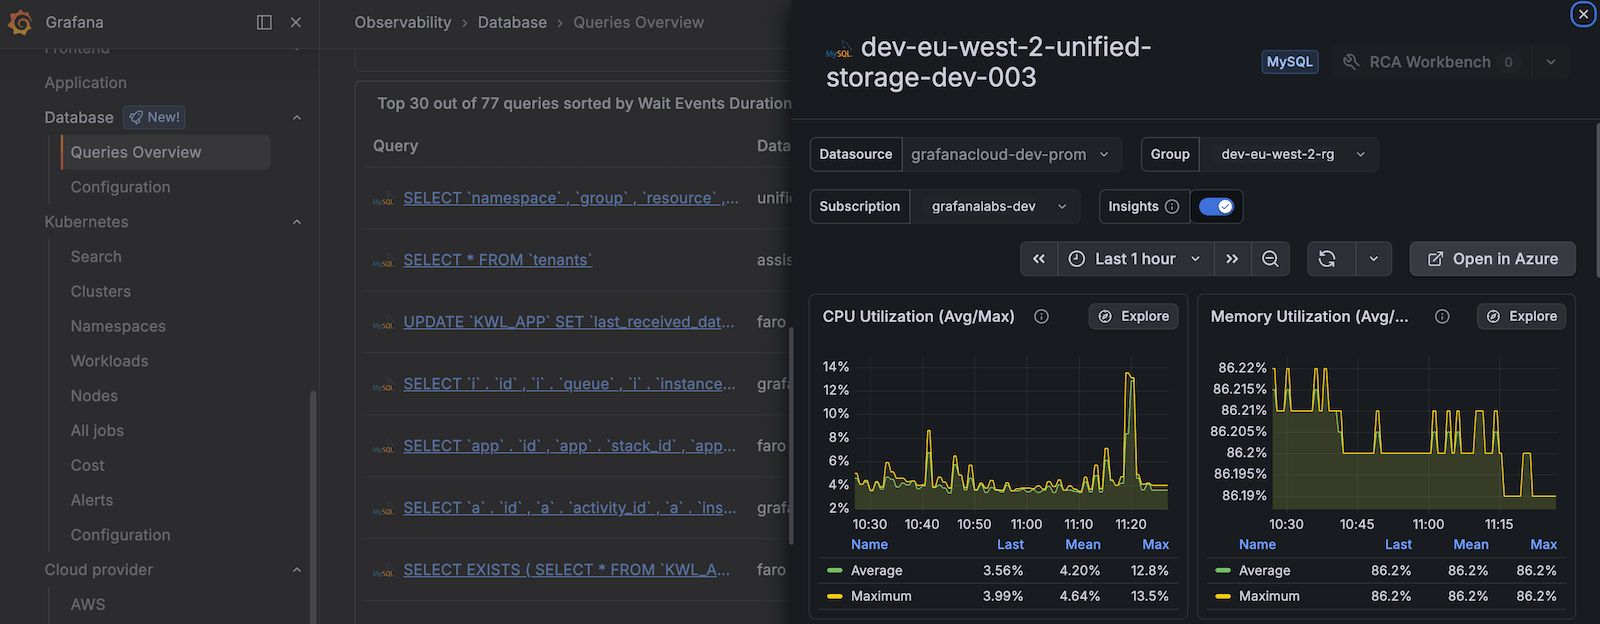
To return to Cloud Provider Observability from Queries Overview in Database Observability, use either of the following options:
- Instance column: In the query table, click an instance name in the Instance column. In the side panel, review infrastructure metrics for that instance, such as CPU utilization and read/write latency. Click Open in AWS, Open in Azure, or Open in GCP to open the matching Cloud Provider instance dashboard.
- Back to button: At the bottom of Queries Overview, click Back to (the label matches your cloud service, for example Back to RDS Instance or Back to Google Cloud SQL).
For more information on monitoring query performance and infrastructure metrics together, refer to View query performance.
GCP Logs
Grafana Alloy sends logs from Cloud Monitoring to Grafana Cloud. Logs are sent from Cloud Monitoring through a log sink to a Pub/Sub topic. The GCP SDK is used for pulling and receiving messages from Pub/Sub. The service account enables Alloy to read the logs from the Pub/Sub subscription. Alloy then sends the logs to Grafana Cloud.

To get GCP Logs running, refer to Configure GCP Logs.
GCP Logs view


