Menu
Grafana Cloud
Enterprise
Open source
Annotations
Annotations is a general term for several Grafana artifacts:
- Native annotations
- Alerts
- Annotation queries
The differences between annotation types are explained in the Grafana Crash Course.
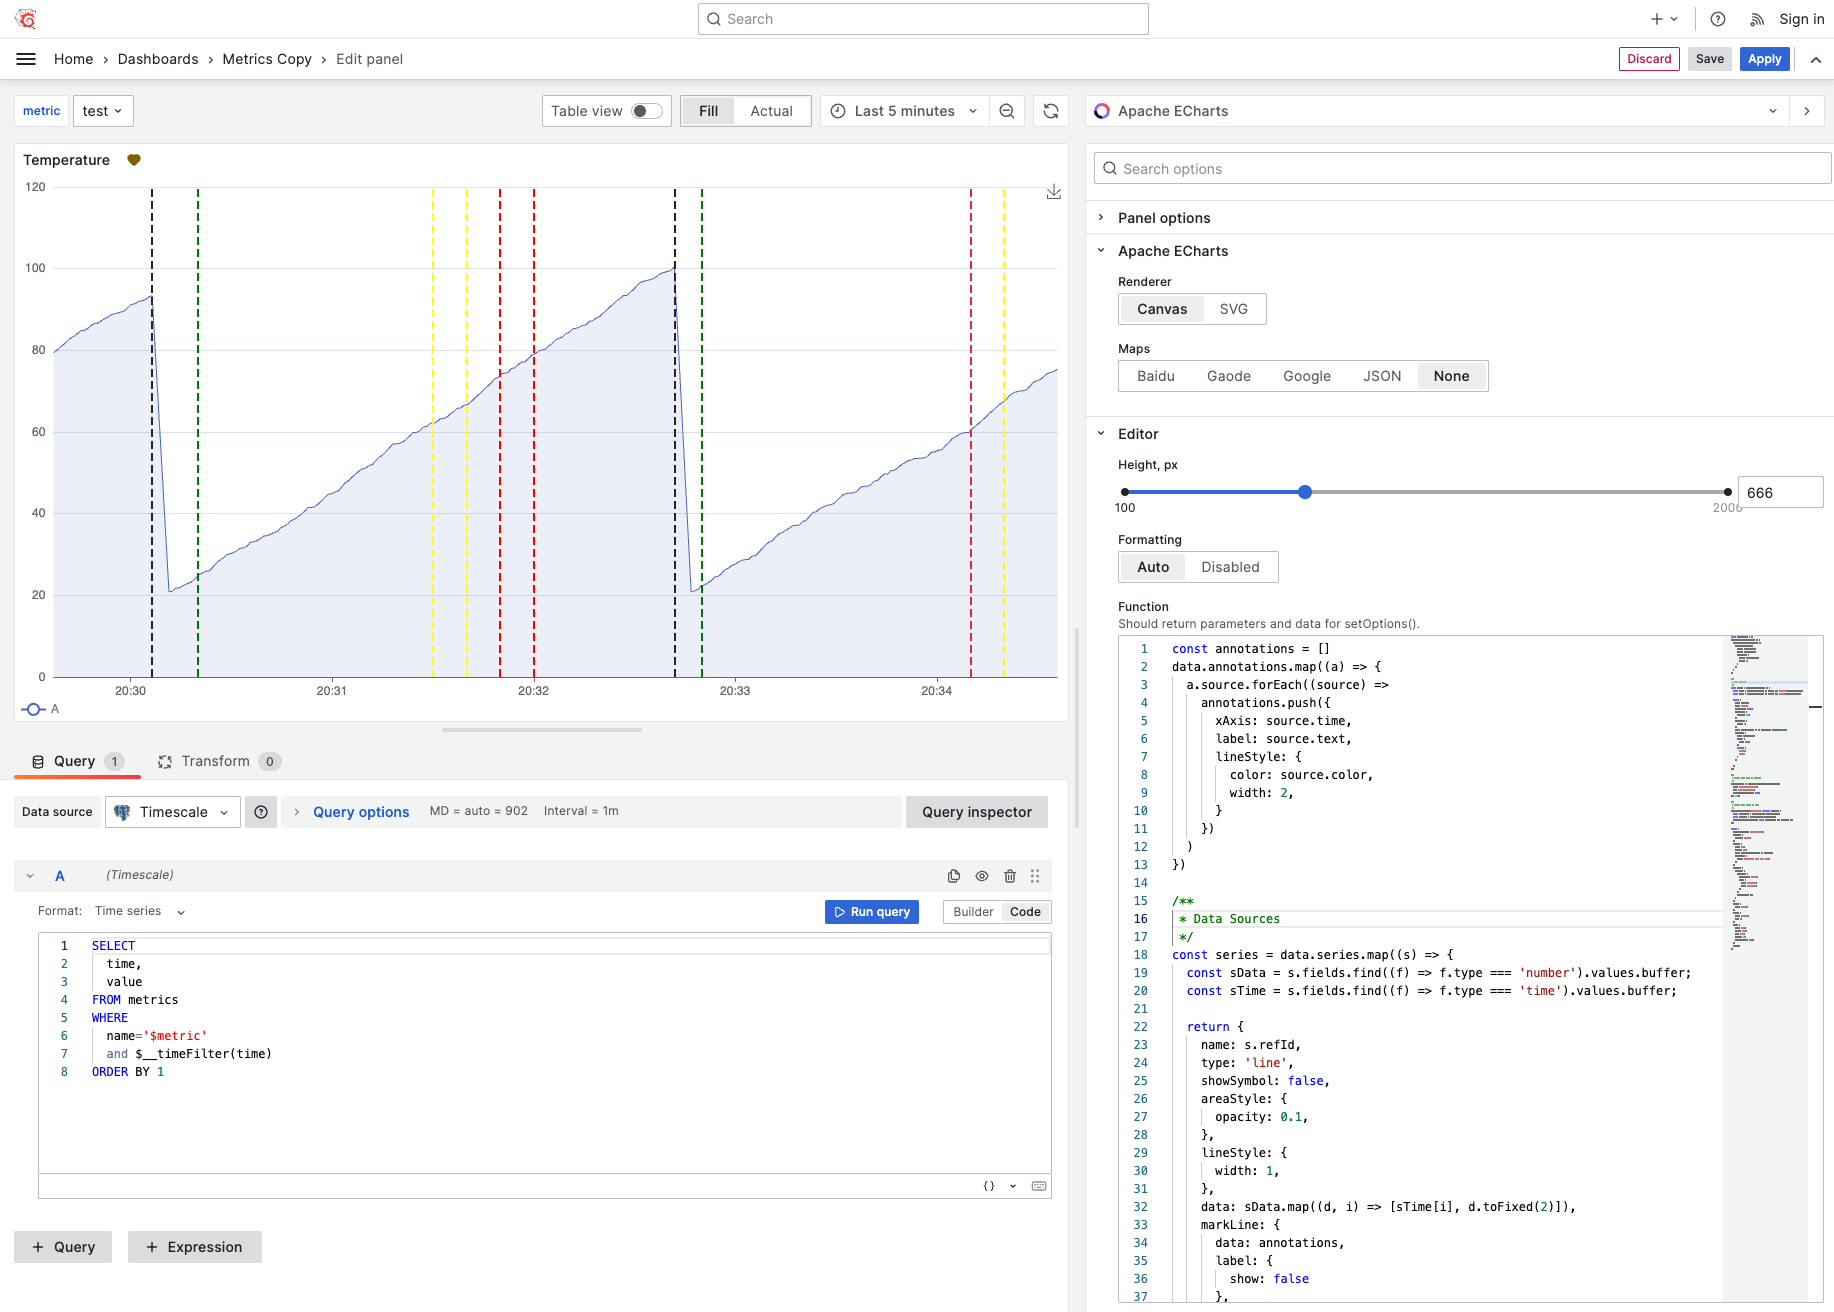
Mark lines
The Business Charts panel displays annotations with mark lines. Data for mark lines comes from the context.panel.data.annotations object.
Example
const annotations = [];
context.panel.data.annotations.map((a) => {
  a.source.forEach((source) =>
    annotations.push({
      xAxis: source.time,
      label: source.text,
      lineStyle: {
        color: source.color,
        width: 2,
      },
    })
  );
});

/**
 * Data Sources
 */
const series = context.panel.data.series.map((s) => {
  const sData = s.fields.find((f) => f.type === "number").values;
  const sTime = s.fields.find((f) => f.type === "time").values;

  return {
    name: s.refId,
    type: "line",
    showSymbol: false,
    areaStyle: {
      opacity: 0.1,
    },
    lineStyle: {
      width: 1,
    },
    data: sData.map((d, i) => [sTime[i], d.toFixed(2)]),
    markLine: {
      data: annotations,
      label: {
        show: false,
      },
      symbol: ["none", "none"],
    },
  };
});

/**
 * Enable Data Zoom by default
 */
setTimeout(
  () =>
    context.panel.chart.dispatchAction({
      type: "takeGlobalCursor",
      key: "dataZoomSelect",
      dataZoomSelectActive: true,
    }),
  500
);

/**
 * Update Time Range on Zoom
 */
context.panel.chart.on("datazoom", function (params) {
  const startValue = params.batch[0]?.startValue;
  const endValue = params.batch[0]?.endValue;
  context.grafana.locationService.partial({ from: startValue, to: endValue });
});

/**
 * Options
 */
return {
  backgroundColor: "transparent",
  tooltip: {
    trigger: "axis",
  },
  legend: {
    left: "0",
    bottom: "0",
    data: context.panel.data.series.map((s) => s.refId),
    textStyle: {
      color: "rgba(128, 128, 128, .9)",
    },
  },
  toolbox: {
    feature: {
      dataZoom: {
        yAxisIndex: "none",
        icon: {
          zoom: "path://",
          back: "path://",
        },
      },
      saveAsImage: {},
    },
  },
  xAxis: {
    type: "time",
  },
  yAxis: {
    type: "value",
    min: 0,
  },
  grid: {
    left: "1%",
    right: "1%",
    top: "2%",
    bottom: 24,
    containLabel: true,
  },
  series,
};

