What's new from Grafana Labs
Grafana Labs products, projects, and features can go through multiple release stages before becoming generally available. These stages in the release life cycle can present varying degrees of stability and support. For more information, refer to release life cycle for Grafana Labs.
Loading...
Area of interest:
Cloud availability:
Cloud editions:
Self-managed availability:
Self-managed editions:
No results found. Please adjust your filters or search criteria.
There was an error with your request.
We’re excited to announce the public preview of Secrets Management for Grafana Cloud k6, a new feature that lets you securely store and use sensitive values in your performance tests. If your tests rely on API tokens, credentials, or any other confidential data, you no longer need to hardcode them into your scripts or pass them around manually.
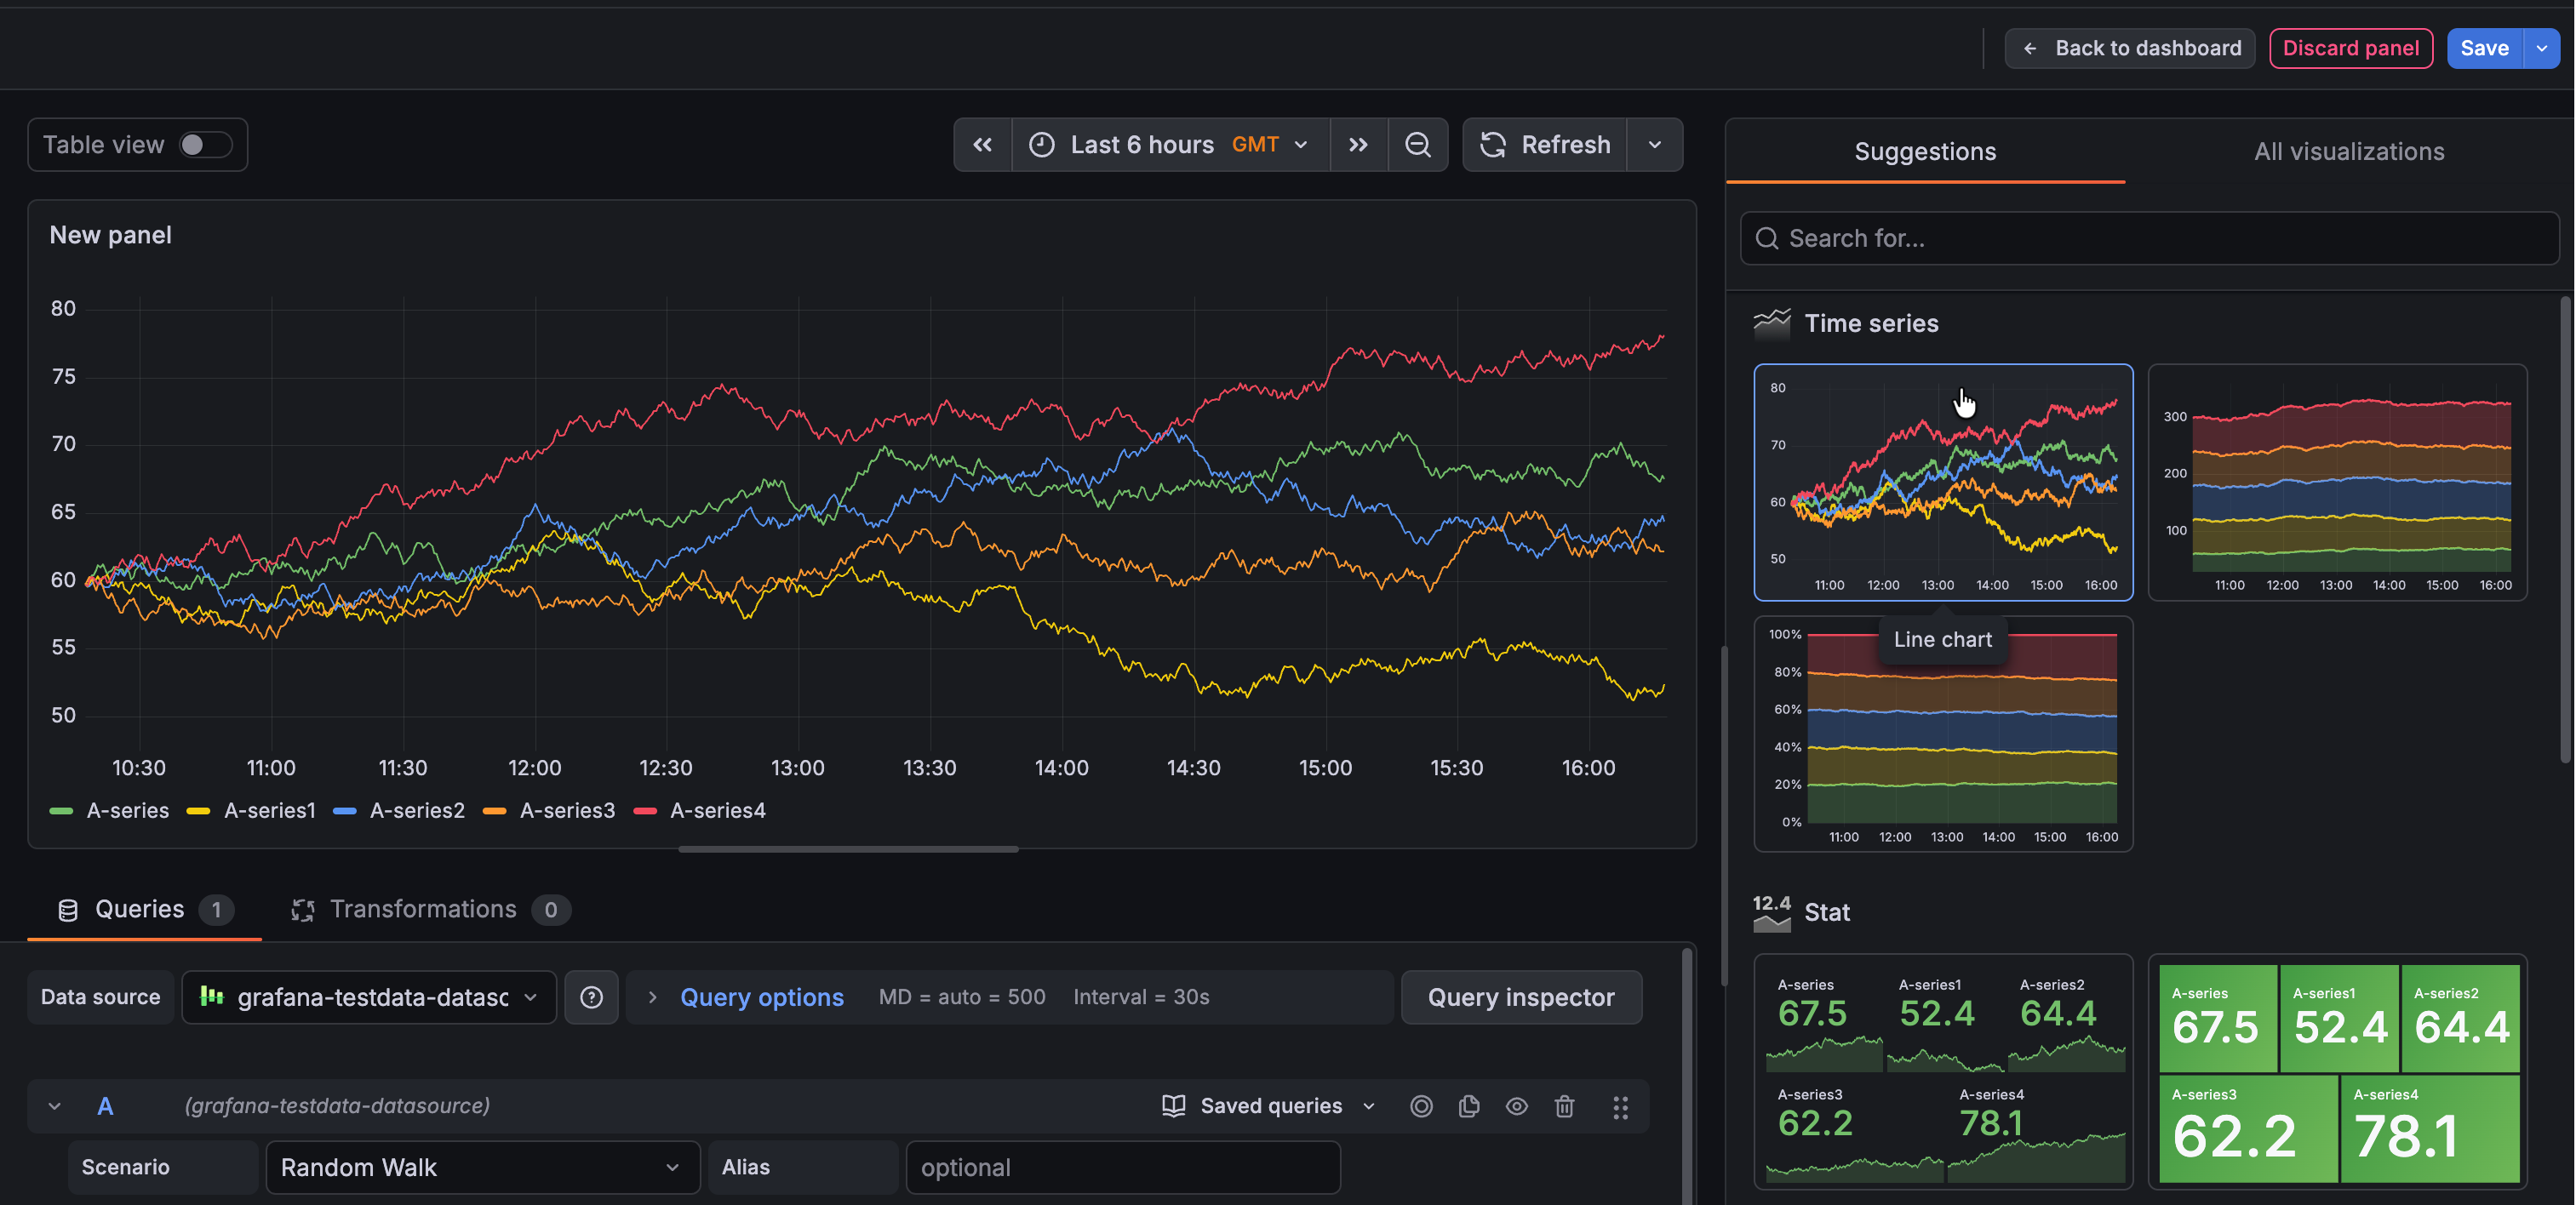
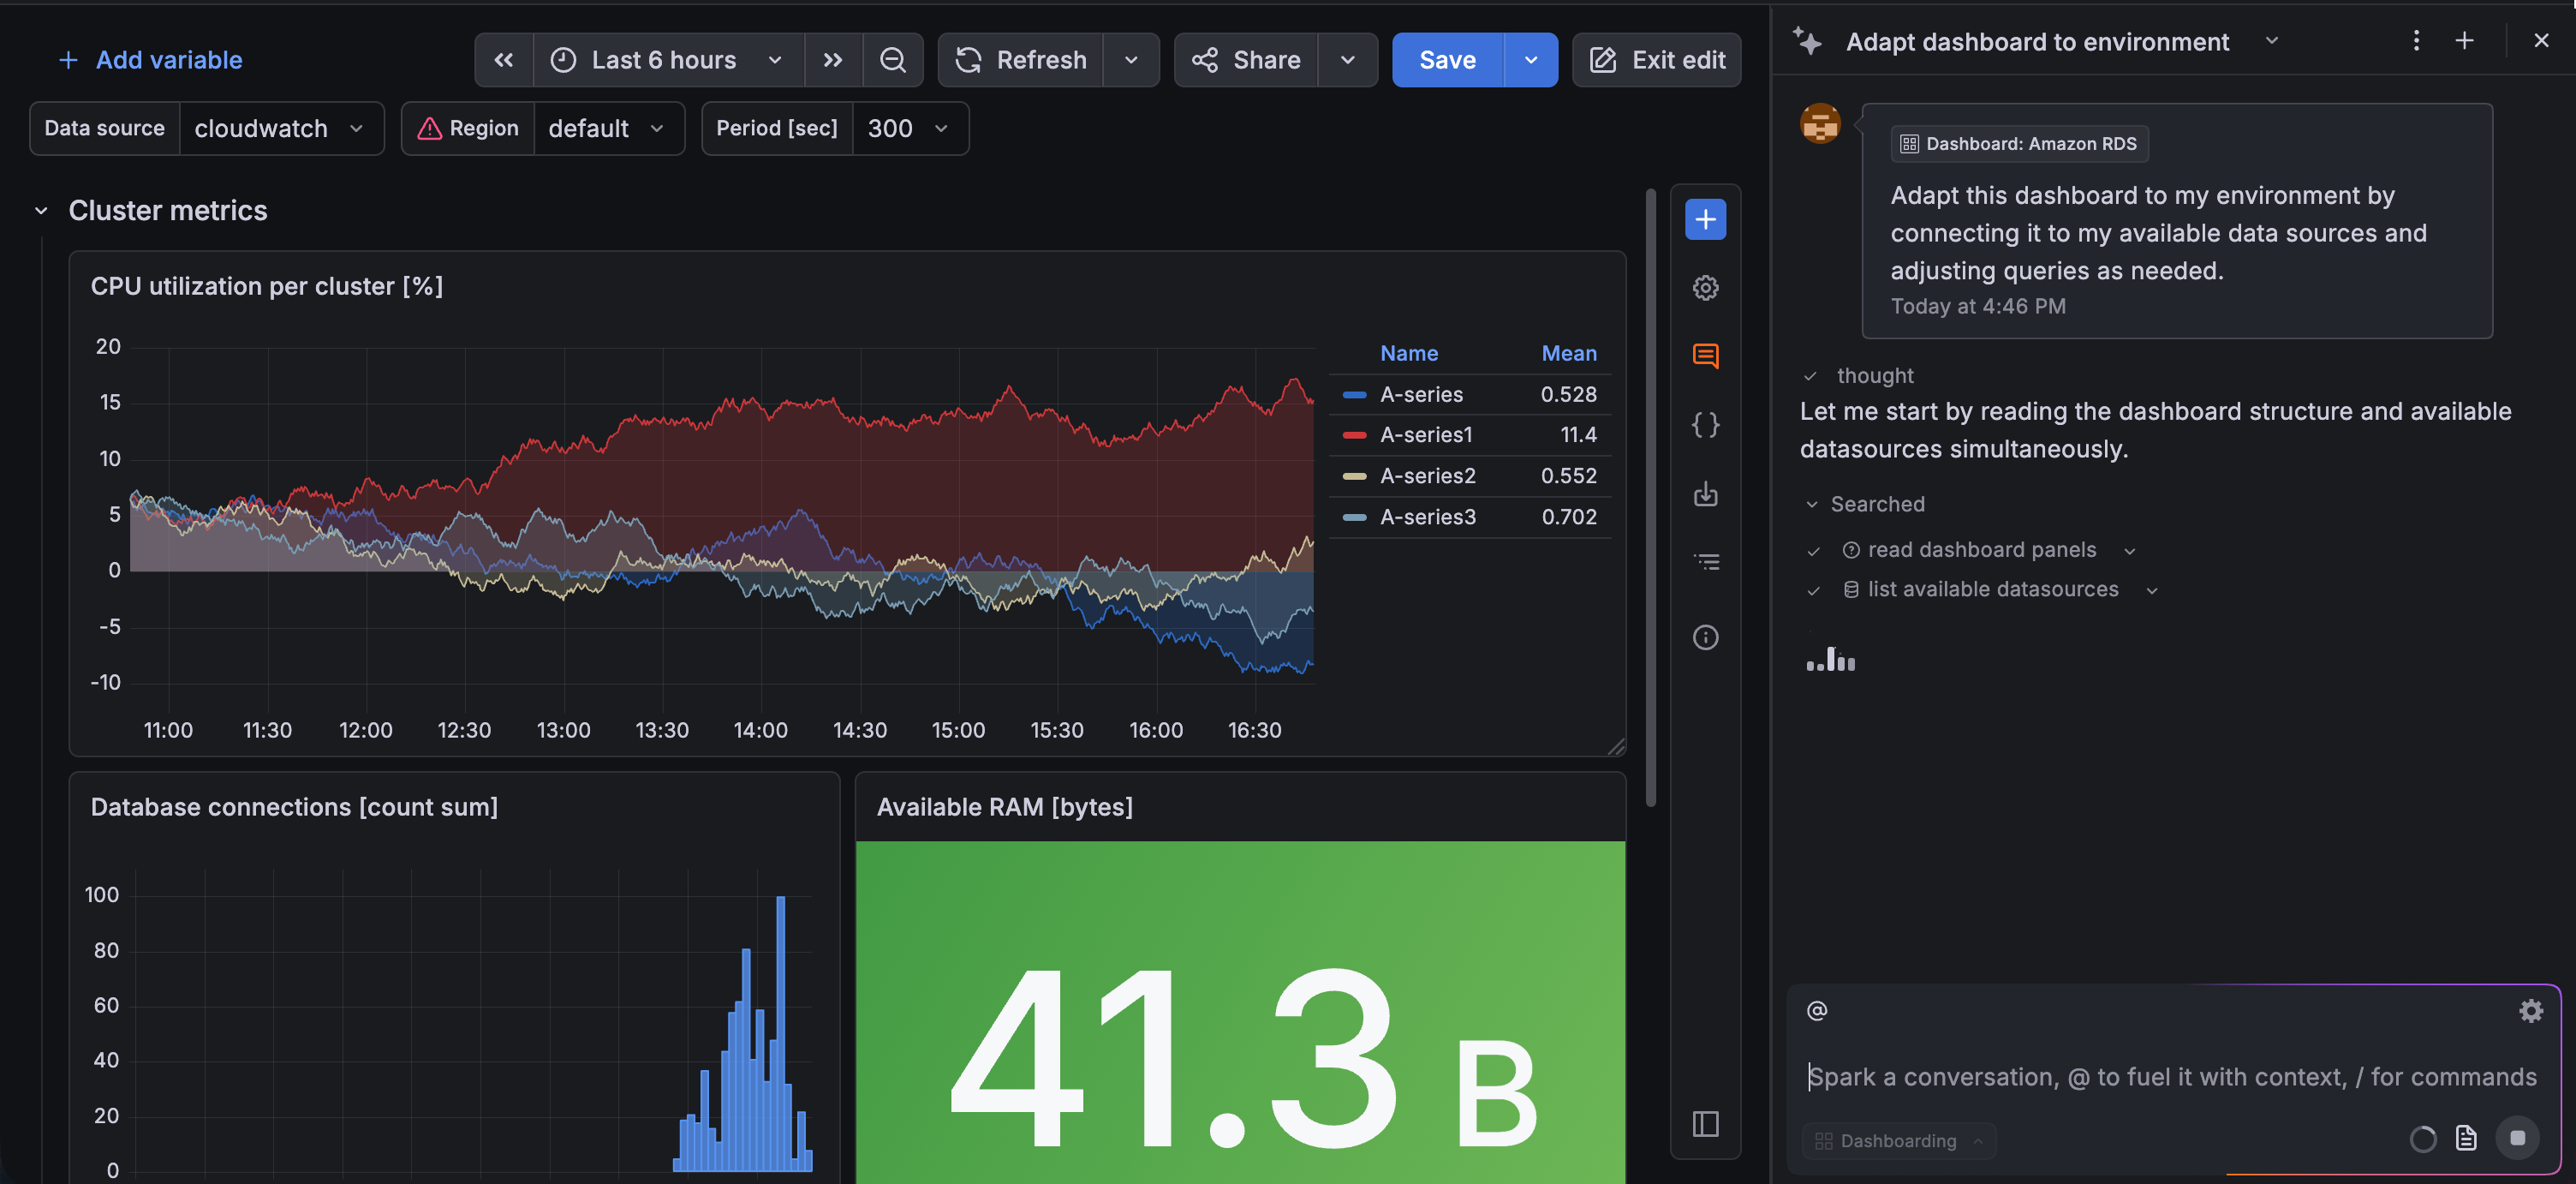
You can now customize suggested dashboards directly with Grafana Assistant, making it easier to turn recommendations into dashboards tailored to your environment.
When you build a dashboard from a data source, you’ll see a Customize with Assistant option when you hover your cursor over a suggestion. This launches Grafana Assistant with a preconfigured prompt that guides you through adapting the selected dashboard:
As Grafana evolves into a multi-tenant architecture, keeping the operational quality high requires predictable performances. For this reasons we are introducing limits to the number of dashboards and folders that can be created in each Grafana stack. Specifically, we are introducing:
The grafana.com/provenance annotation on alerting notification resources is now correctly
read and enforced when writing using the Kubernetes-style API. Previously, provenance was
hardcoded to none on all Kubernetes API writes, so the annotation was silently ignored. It is now respected. Setting it requires one of the following permissions:
In Grafana v12.0, we deprecated several Alertmanager configuration API endpoints that rely on legacy single-tenant Alertmanager configuration semantics. In Grafana v13.0 we are removing or restricting access to them:
Remote configuration, a key feature of Grafana Fleet Management, relies on collectors to poll the Fleet Management server at regular intervals for configuration changes.
The problem with this automated approach is that it can be hard to tell when a collector has loaded the new remote configuration or if it experienced a configuration error.
In Grafana v11, we enabled Scenes-powered architecture for dashboards, however the feature could still be disabled. In this release, we’ve removed the the ability to disable Scenes.
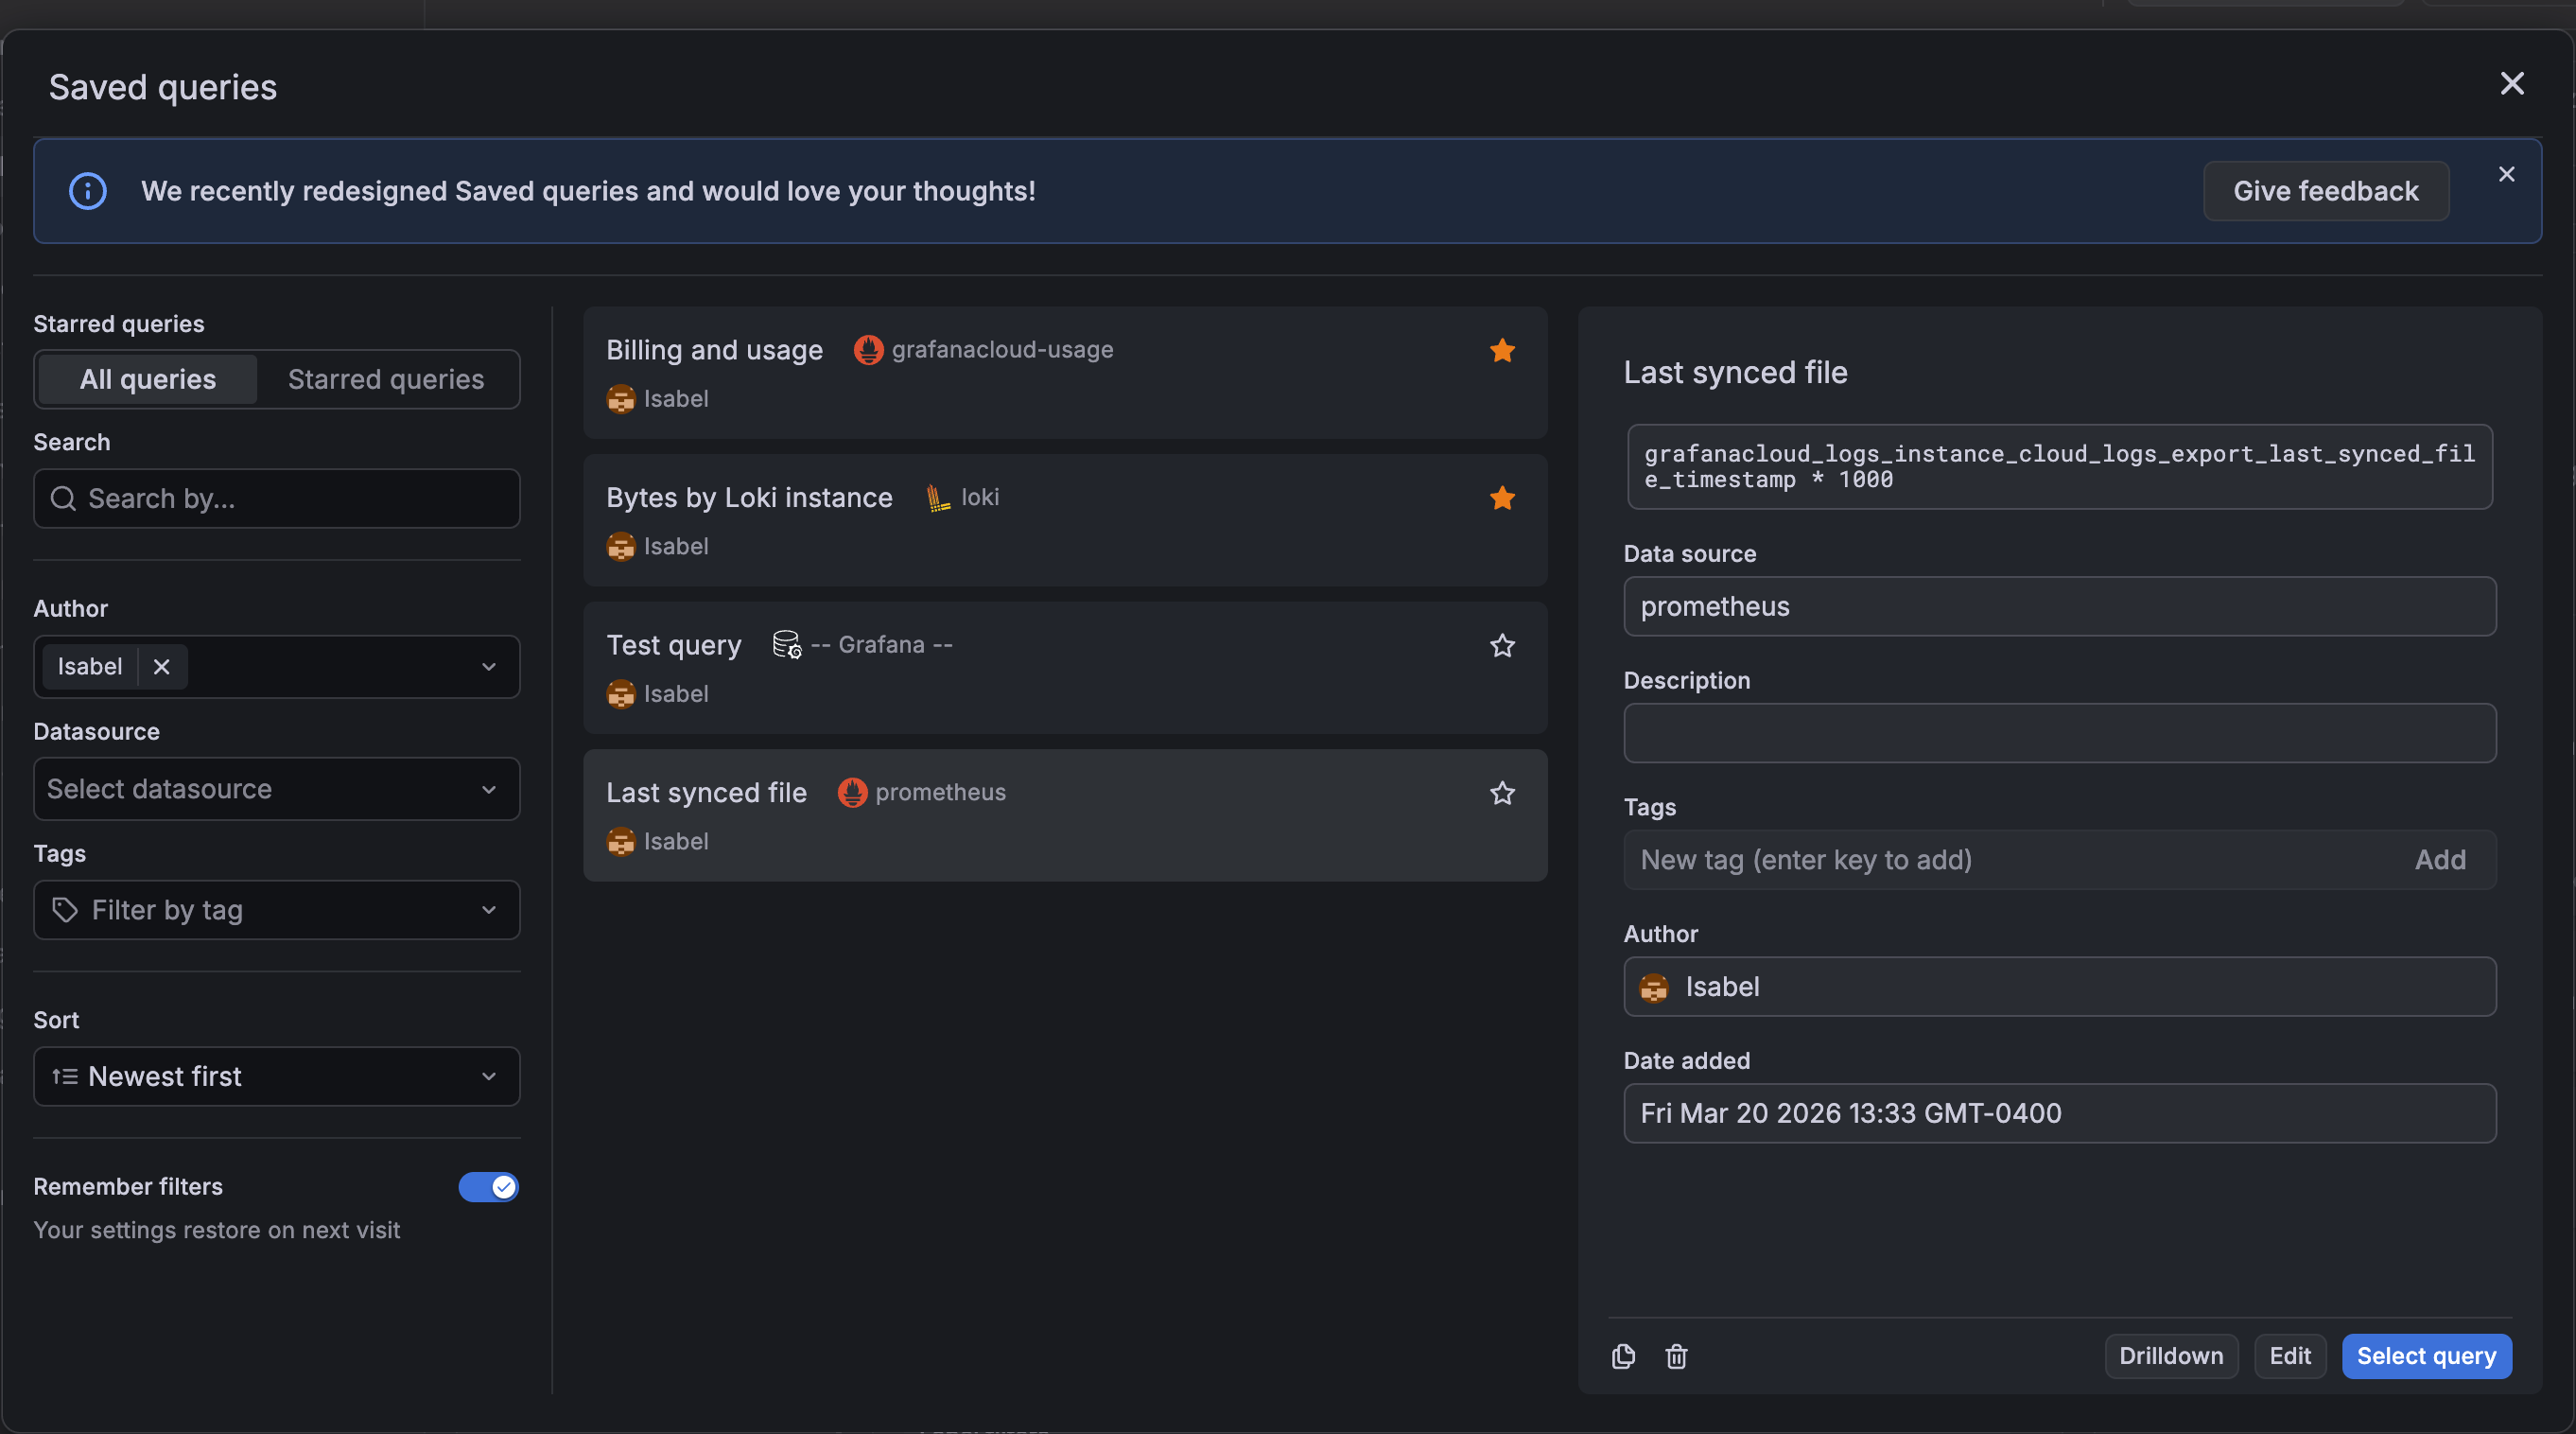
We’ve redesigned the panel configuration experience to include the option to use a saved query.
When you add a panel to a dashboard, you now have three starting points: an empty panel, a library panel, or a saved query. Select Use saved query to open the Saved queries dialog box and choose a query. Grafana then generates a ready-to-edit panel—including a recommended visualization—so you can add a useful panel to your dashboard without even entering panel edit mode:
We’ve updated the saved queries experience to improve usability.
The Saved queries drawer has been replaced with a dialog box, providing more space for query titles, data source names, and other query details. The individual query cards also have a refreshed design, allowing for easier readability.
Database Observability brings your MySQL and PostgreSQL query performance data directly into Grafana Cloud, right alongside your metrics, logs, and traces.
With Database Observability, you can identify slow and failing queries, understand wait events, analyze explain plans, and examine query samples all within Grafana. Connect your databases through Grafana Alloy and get instant visibility into what’s happening across your fleet.
We’ve released an update to the billed usage CSV export that adds per-stack cost visibility
You can now see how much each stack contributes to your organization’s monthly bill, alongside the existing usage data
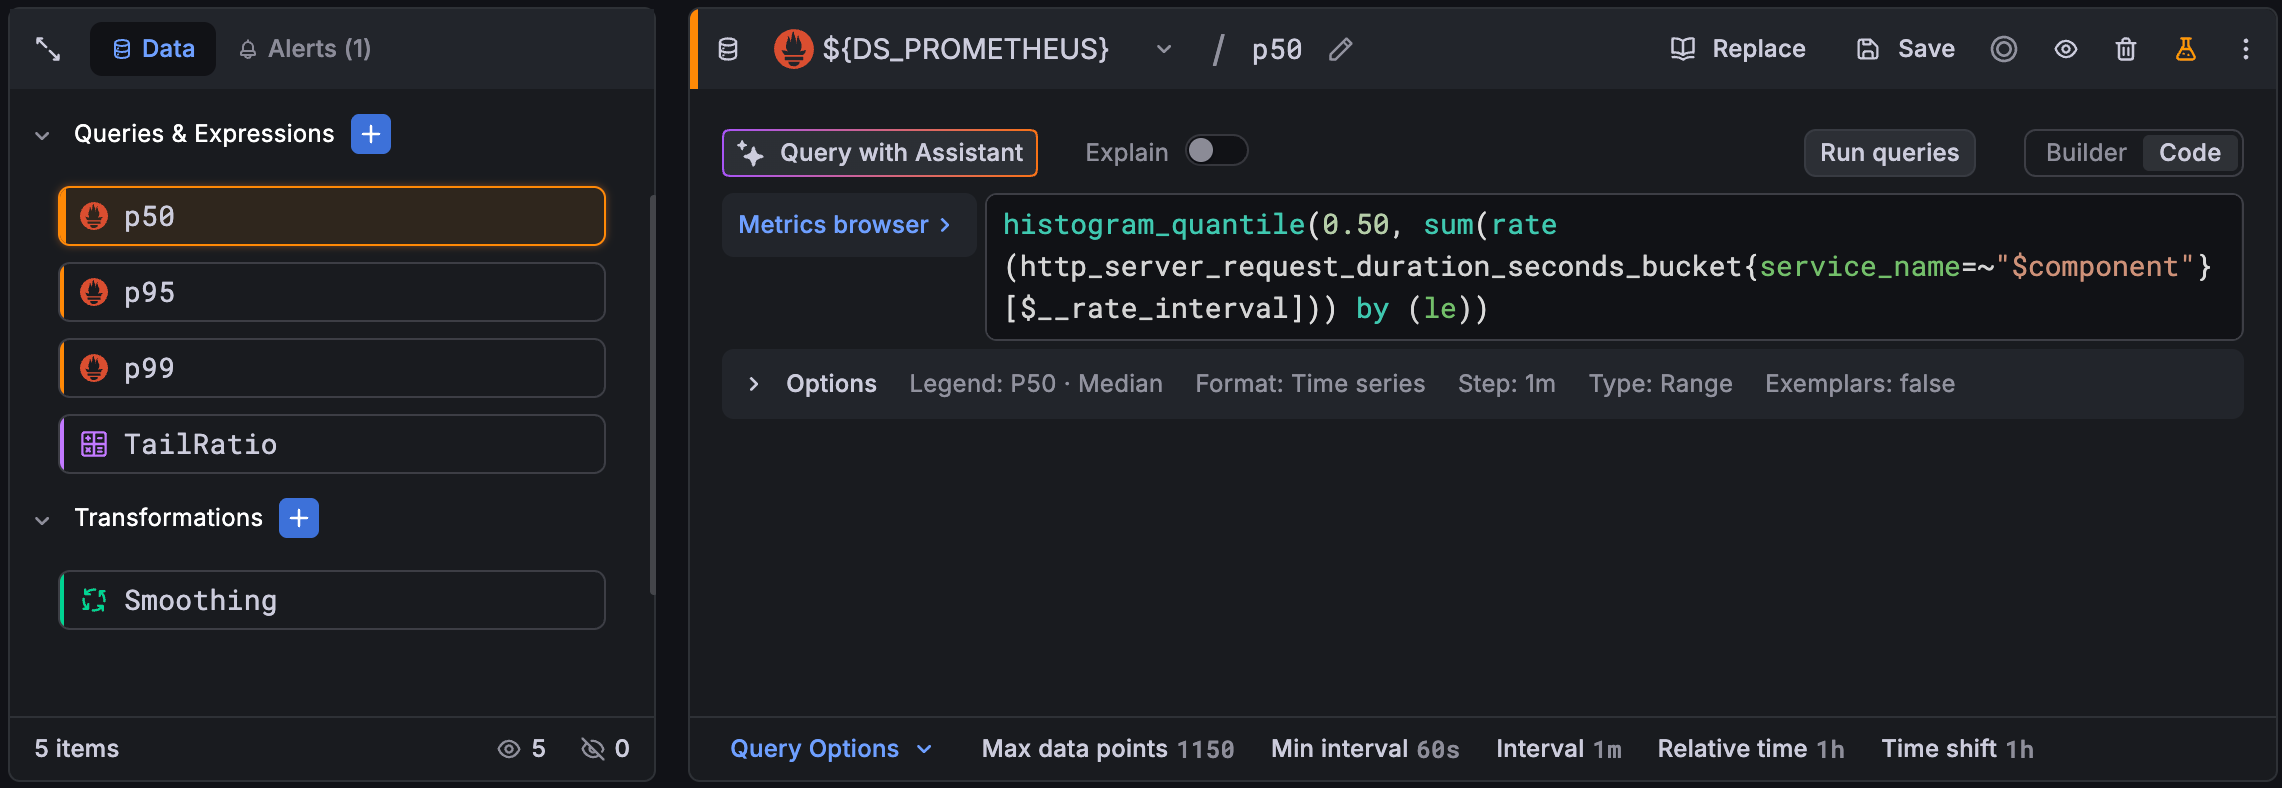
We’ve redesigned the query editor to make complex panels easier to build and manage. The new experience provides a unified view of your entire data pipeline—queries, expressions, transformations, and related alerts—with clearer visual feedback and faster access to the settings that matter.
The GET /api/alertmanager/grafana/api/v2/status endpoint previously required the legacy alert.notifications:read permission. It now requires a dedicated alert.notifications.system-status:read permission. This new permission is included in the fixed:alerting.notifications:writer role, which is granted to Admin users by default.
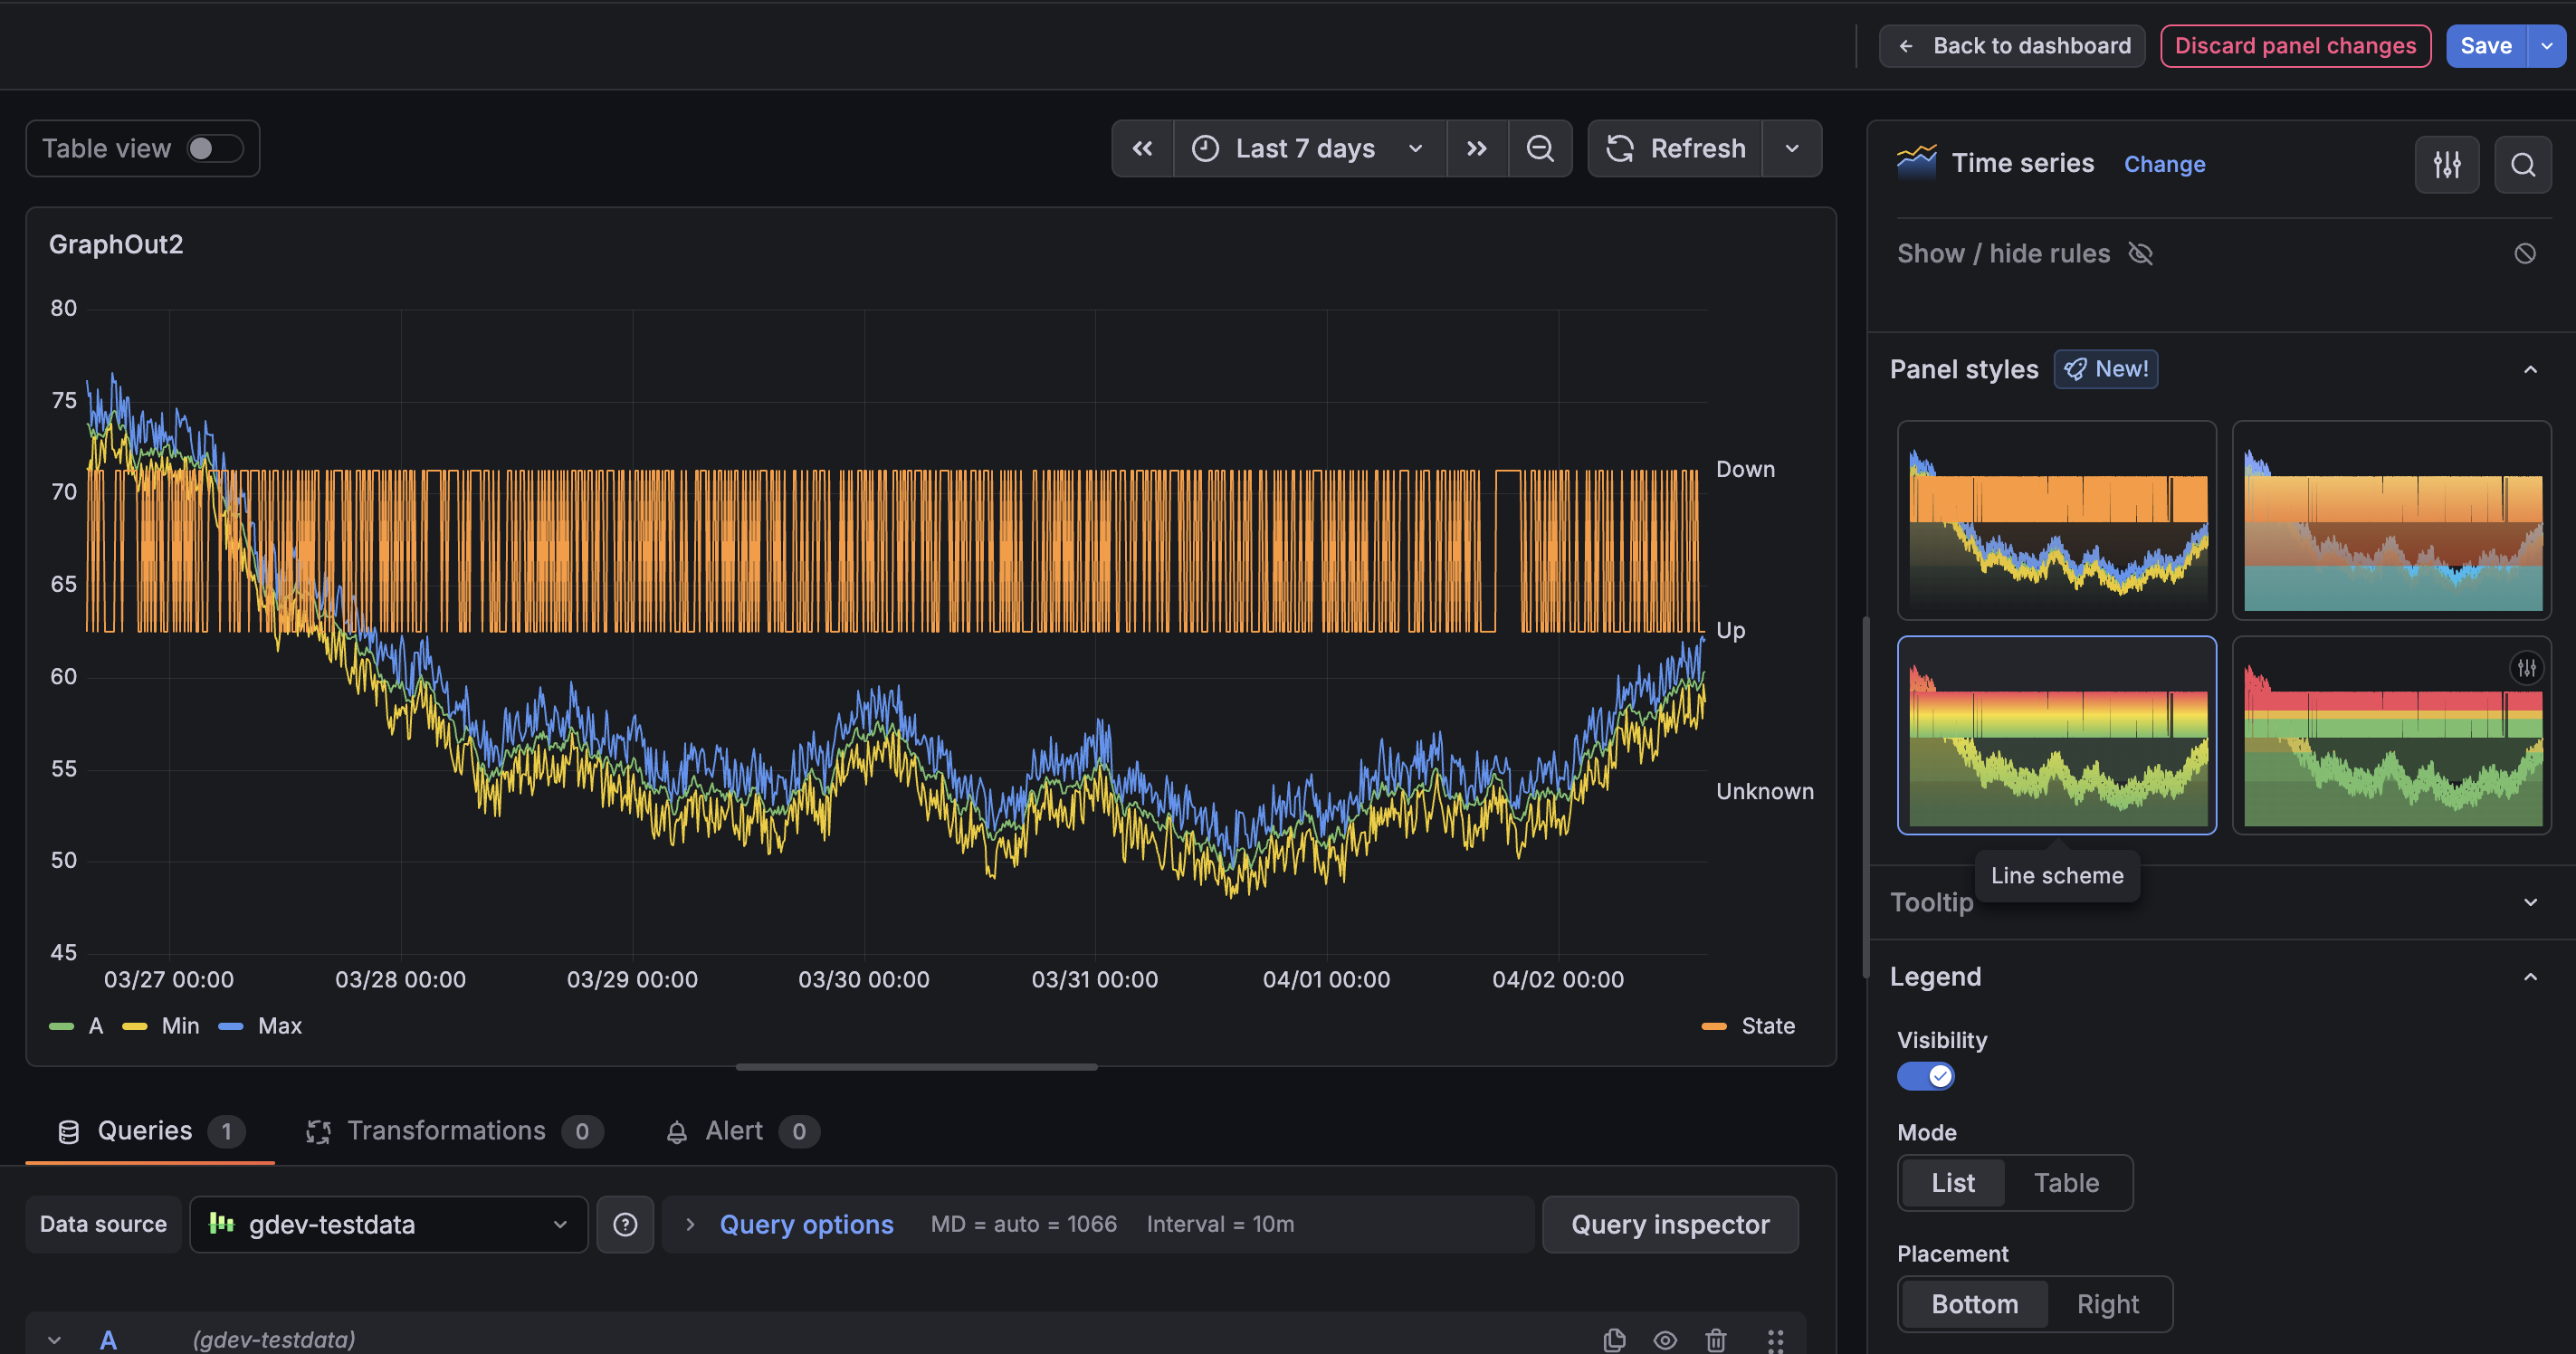
You can now apply Panel styles to quickly update your panels without adjusting multiple options manually. Panel styles provide a curated set of configurations—such as colors, thresholds and display options—so you can quickly get to a more polished visualization with a single click. Panel styles are currently supported in time series, gauge, bar gauge, stat, and bar chart visualizations.
In January 2026, we announced improvements to visualization suggestions in public preview. These changes included higher quality suggestions leveraging information provided by data sources, as well as minor user interface updates. These improvements are now generally available.