
How to generate real-world load tests using Grafana Cloud k6 and production telemetry
For many development teams, a load test starts with a set of assumptions.
You pick 100 virtual users because it sounds reasonable. You ramp for 30 seconds because that's what the tutorial showed. You set a 500ms threshold because it feels like a good target. The test passes, you ship the release, and production falls over at 6 p.m. on a Tuesday because your synthetic load never resembled how real users interact with your application.
The good news is that, if you're running Grafana Cloud, you already have the data you need to run realistic load tests. Your dashboards capture how your users behave, including request rates, latency distributions, and traffic patterns over time. The signal is already there; you just need to connect it to your test configuration.
Using production telemetry to shape your tests makes the results far more meaningful. Instead of validating against a hypothetical workload, you're testing against patterns your systems already experience, leading to more reliable baselines, better thresholds, and fewer surprises in production.
This post walks through how to do exactly that: pull real telemetry signals from Grafana Cloud and translate them into a Grafana Cloud k6 testing scenario that reflects production environments (rather than assumptions).
VU count isn’t the only place to start
Virtual user (VU) count is an important part of how Grafana Cloud k6, the fully managed performance testing platform powered by k6 OSS, runs tests. However, VU count doesn’t always need to be the first lever you pull. When your goal is to test how a service behaves under a known request rate, arrival-rate executors let you express that intent more directly.
What you may care about is the arrival rate, or how many requests per second your system handles. VU count is a byproduct of arrival rate and response time. If your p95 latency doubles, you need twice as many VUs to sustain the same throughput. Start from VUs and you're tuning the wrong variable.
This distinction often comes down to API testing vs. website testing. There is typically a difference between trying to simulate a number of "real users," including their actions and pauses and how those translate into backend capacity, vs. simulating a certain throughput on API endpoints. While the underlying test is ultimately similar, how you derive those traffic levels depends on the type of telemetry data you're working with. For instance, analyzing and simulating full user sessions would align more with Grafana Cloud Frontend Observability, whereas the metrics described below are focused on deriving the traffic levels of your API endpoints.
k6 has two executor types that map directly to how real traffic works:
constant-arrival-rate: a fixed number of iterations per second, regardless of how long each one takes. Use this when you want to hold a steady request rate and observe what happens to latency under that pressure.ramping-arrival-rate: arrival rate changes over time according to stages you define. Use this when your traffic has a shape: a morning ramp, an evening peak, a midday lull.
Both of these need real numbers to be useful. Here's how to get them.
Step 1: Find your actual request rate
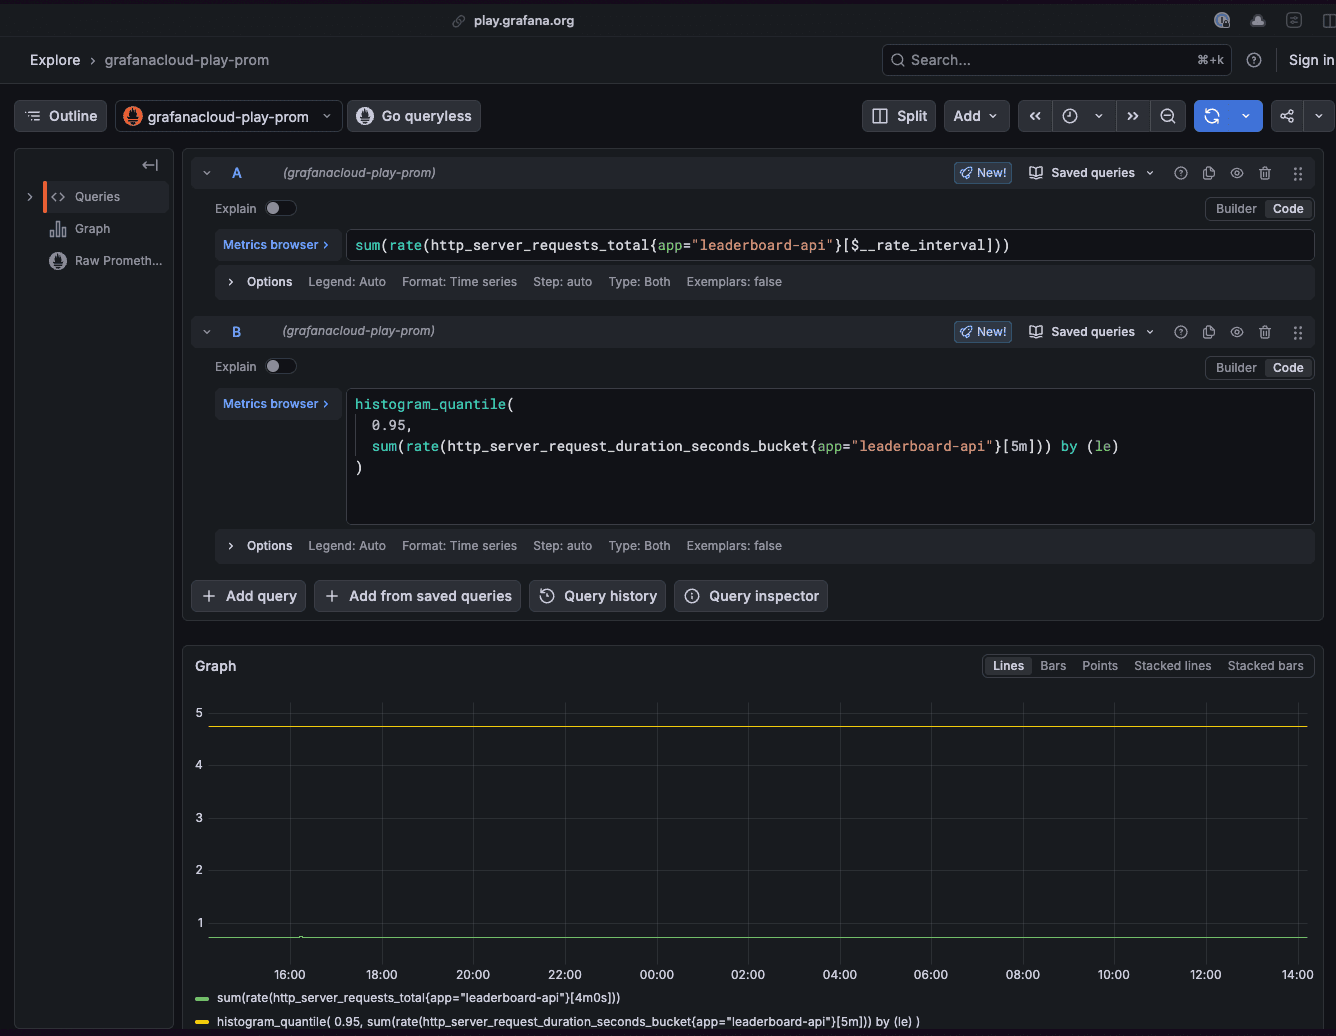
Open Grafana Cloud and run this query against your Prometheus or Mimir data source. Swap in your service name:
sum(rate(http_server_requests_total{app="leaderboard-api"}[$__rate_interval]))Look at this over a representative window. A full week is better than a single day. You're looking for two things:
- Your baseline rate during normal operation (requests per second)
- Your peak rate, which is the highest sustained load you've actually seen
That peak number is your load test target. Not a guess or just 2x your average, but the actual peak your system has handled (or needs to handle).
If your baseline is 120 req/s and your peak is 340 req/s, you now have real numbers to work with.
Step 2: Get your latency baseline
This becomes your threshold. Run this query to get p95 latency under normal production load:
histogram_quantile(
 0.95,
 sum(rate(http_server_request_duration_seconds_bucket{app="leaderboard-api"}[5m])) by (le)
)
This value becomes the check in your Grafana Cloud k6 script, for example: http_req_duration: ["p(95)<280"].
Whatever this returns, such as 280ms, that's your threshold. If your load test pushes p95 above 280ms, the test should fail.
Also pull p99 while you're here. A gap between p95 and p99 tells you something about tail latency behavior that will matter under load.
Step 3: Read your traffic shape
Effective traffic modeling isn't just about mimicking a 24-hour cycle; it's about modeling your test configuration after the specific performance question you want to answer. Pull your request rate panel and look at the line's shape, then choose one of these four customer-modeled patterns to guide your stages array:
- Constant load: Stay at a small percentage above your baseline for an extended time to verify steady-state stability.
- Stress: Step through increasing load levels to identify the exact breakdown point where latency or error rates spike.
- Spike: Ramp to your observed peak quickly for a short duration to test how the system handles sudden bursts of traffic.
- Endurance: Maintain a baseline load for a very long period to uncover resource leaks or performance degradation over time.
For example, a stress test designed to find the breaking point might use stages that step through increasing load levels:
stages: [
  { target: 60, duration: "5m" },   // 50% of baseline
  { target: 120, duration: "5m" },  // baseline
  { target: 240, duration: "5m" },  // 2x baseline
  { target: 340, duration: "5m" },  // observed peak
  { target: 0, duration: "5m" },    // ramp down and cool off
]
In this case, you're not making this up; you're reading it off the dashboard.
Step 4: Wire it all together in Grafana Cloud k6
Here's what a full scenario config looks like when built from real data instead of assumptions:
import http from "k6/http";
import { check } from "k6";

export const options = {
  scenarios: {
    realistic_load: {
      executor: "ramping-arrival-rate",

      // Derived from observed peak concurrency in Grafana
      preAllocatedVUs: 50,
      maxVUs: 200,

      // Derived from your traffic shape panel
      stages: [
        { target: 120, duration: "5m" },   // ramp to baseline (req/s)
        { target: 340, duration: "10m" },  // push to observed peak
        { target: 120, duration: "5m" },   // return to baseline
      ],
    },
  },

  thresholds: {
    // Derived from production p95 — not invented
    http_req_duration: ["p(95)<280"],

    // Derived from observed error rate in Grafana
    http_req_failed: ["rate<0.01"],
  },
};

export default function () {
  const res = http.get("https://your-service.example.com/api/health");
  check(res, { "status 200": (r) => r.status === 200 });
}
Every number in that config came from a dashboard query. When a teammate asks why you chose these values, you have an answer.
Step 5: Close the loop back in Grafana Cloud
Run the test and send results to Grafana Cloud k6. Now open the same Grafana Cloud dashboards you pulled the baseline from and add an annotation for the time the test ran.
You're now looking at the same panels for request rate, p95 latency, and error rate during a load test that was designed to match production conditions. If the test surfaces a problem, you already know which dashboard to go to. The debugging context is built in.
This is what the observability and testing loop is supposed to look like: production data informs the test design, and test results feed back into your observability stack. Neither side is isolated.
A simpler way: Generate your script with Grafana Assistant
While calculating all the values manually (request rate, p95 latency, stages) provides maximum control and fidelity, there is an easier path to achieving a production-ready script.
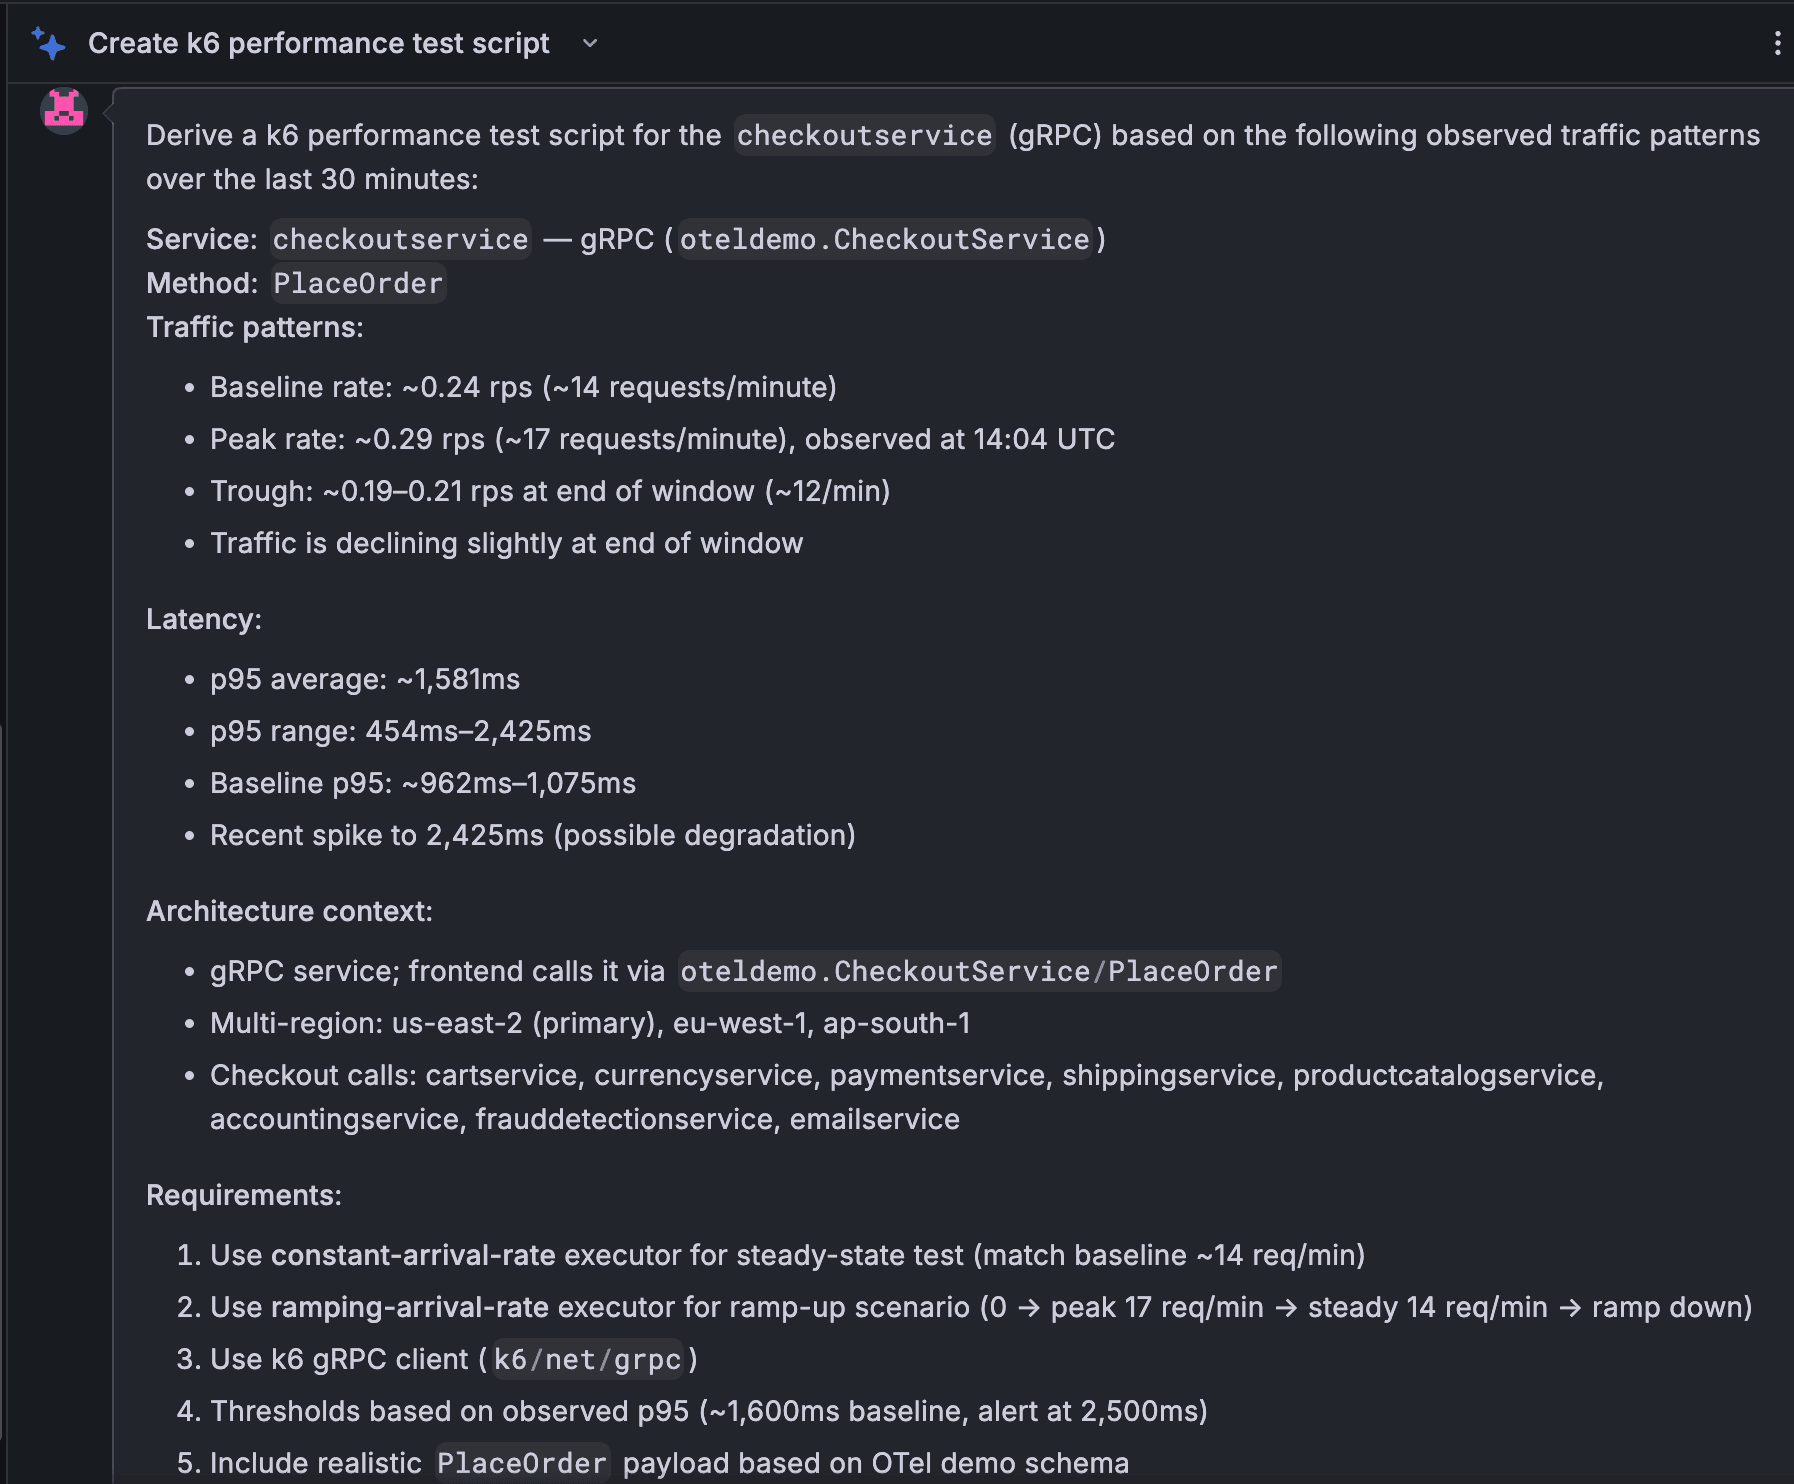
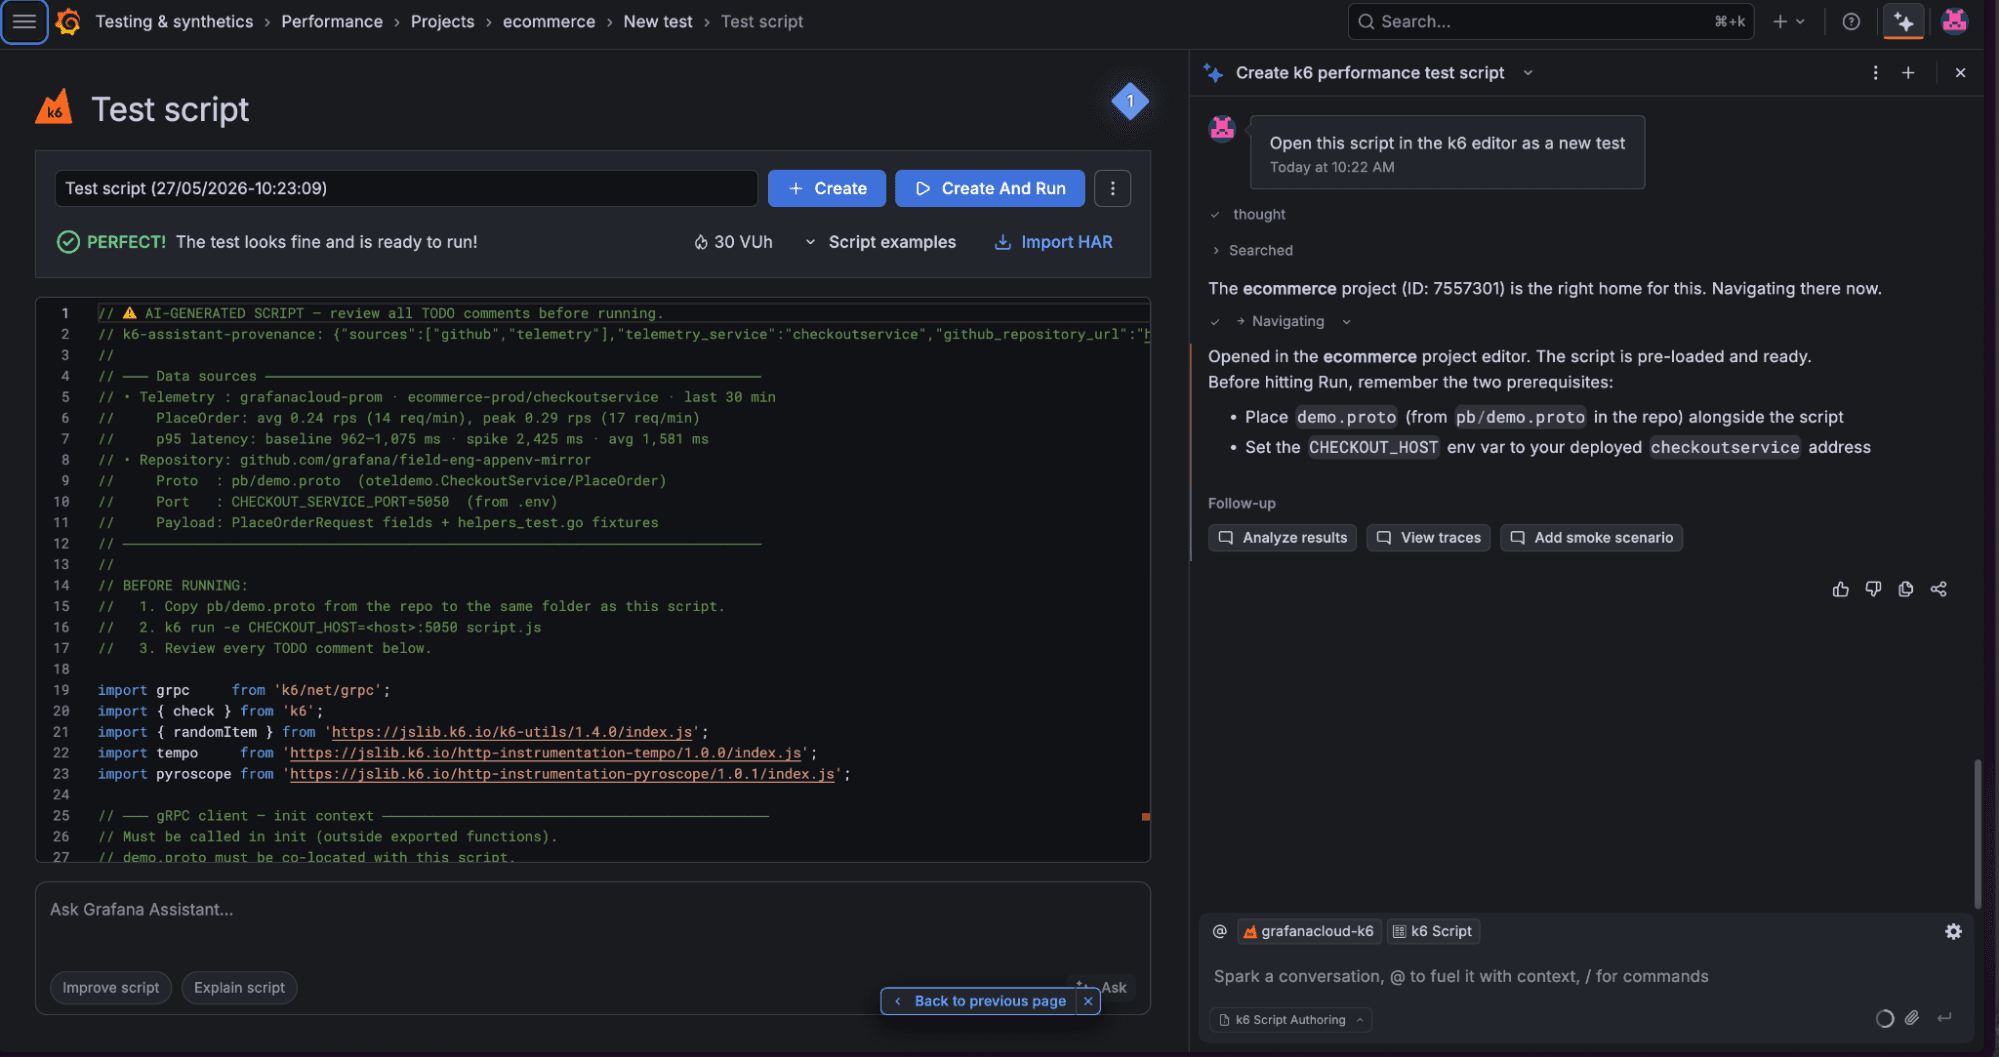
Grafana Assistant, the AI-powered agent in Grafana Cloud, includes a k6 script authoring capability that allows you to generate performance tests using natural language. This feature automates the heavy lifting of performance engineering by programmatically translating production-observed metrics—such as the exact request rates and latency thresholds identified in your panels—directly into a valid k6 configuration. Instead of manually parsing Prometheus queries and hard-coding values into a script, you can simply ask Assistant to derive a test from your service's existing traffic patterns.
Grafana Assistant analyzes your service context, including relevant metrics, logs, and traces, to mirror observed behaviors like morning ramps or evening peaks.
By automatically mapping these real-world traffic patterns to k6 arrival-rate executors and defined stages, Assistant significantly reduces manual effort while ensuring higher fidelity to production conditions. This ensures your tests aren't just syntactically correct, but are grounded in the actual pressure your systems face every day.
To learn more about k6 script authoring in Assistant, please check out our blog post and technical docs.
Wrapping up: what this all means for shift-left testing
Shift-left testing is an approach where testing happens earlier into the development pipeline to catch issues before they impact users. While you can apply this approach to load testing, it doesn’t really help you if you’re testing on assumptions.
Shifting left with fidelity, however, means your pre-production tests reflect the pressure that’s actually applied by production workloads. That requires real data, which Grafana Cloud gives you, and then k6 gives you the test framework to act on it.
Grafana Cloud is the easiest way to get started with k6 and performance testing. We have a generous forever-free tier and plans for every use case. Sign up for free now!