Get started with the knowledge graph
During installation and instrumentation, the knowledge graph builds its features by detecting the signals from Grafana’s observability solutions.
Before you build the knowledge graph, you must enable Grafana Cloud Application Observability or Grafana Cloud Kubernetes Monitoring.
For information about which metrics the knowledge graph requires, refer to Grafana Cloud Knowledge Graph prerequisites.
Before you begin
Before you begin the knowledge graph setup process, ensure the following:
- You are sending Kubernetes or OpenTelemetry data to Grafana Cloud
- You have Grafana Cloud Admin permissions
Activation steps
Complete the following steps to get started with the knowledge graph:
- Sign into Grafana Cloud and click Observability > Entity catalog.
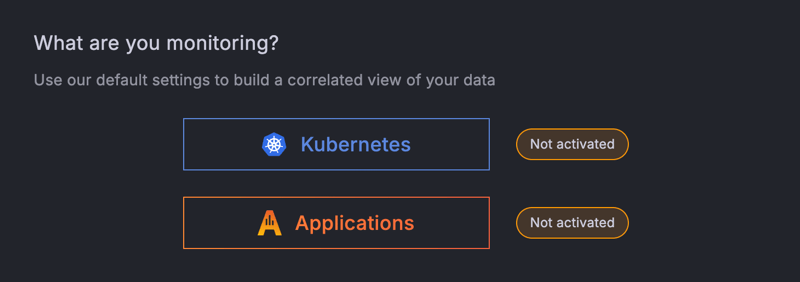
- Click either Kubernetes or Applications.
![Knowledge graph activation page]()
- Confirm your selection and click Activate.
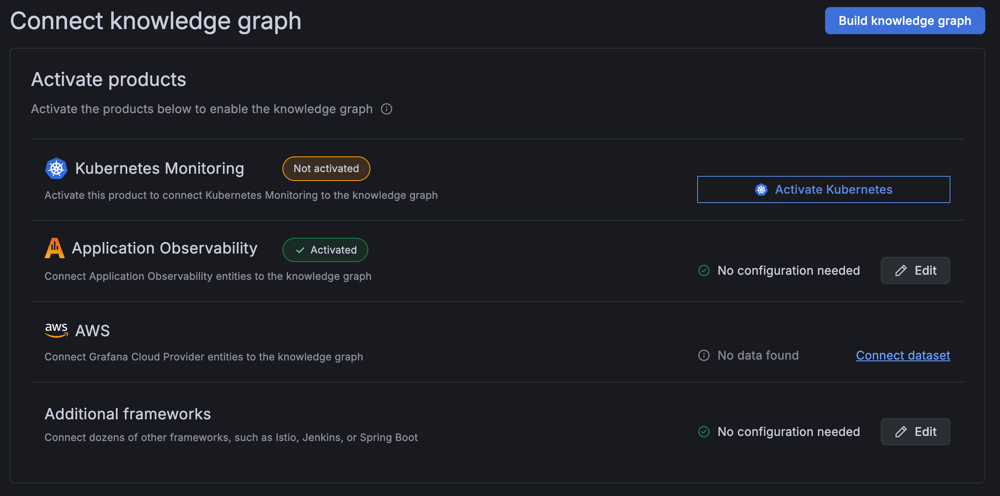
- Optionally, click either Activate Kubernetes or Activate Applications if you want to activate both Kubernetes Monitoring and Application Observability.
![Knowledge graph activate products page]()
- Confirm your selection and click Activate.
- If you didn’t select both Kubernetes Monitoring and Application Observability, click Build Knowledge Graph. Otherwise, the knowledge graph automatically builds.
Next steps
- If you’ve activated the knowledge graph and don’t see entities being discovered, refer to the troubleshooting guide
- If the basic product activation and knowledge graph build does not suit your environment, you can customize your dataset configuration
Deactivate the knowledge graph
You may want to deactivate the knowledge graph if you need to temporarily disable it for maintenance, cost optimization, or if you no longer want to use it.
Warning
Deactivating the knowledge graph stops data collection and insight generation. Pre-built dashboards and knowledge graph specific alert rules are removed.
Before you deactivate
Before you deactivate the knowledge graph, ensure the following:
- You have Grafana Cloud Admin permissions
- You understand the impact on dependent workflows (alerts, dashboards, notifications)
Deactivation steps
Complete the following steps to deactivate the knowledge graph:
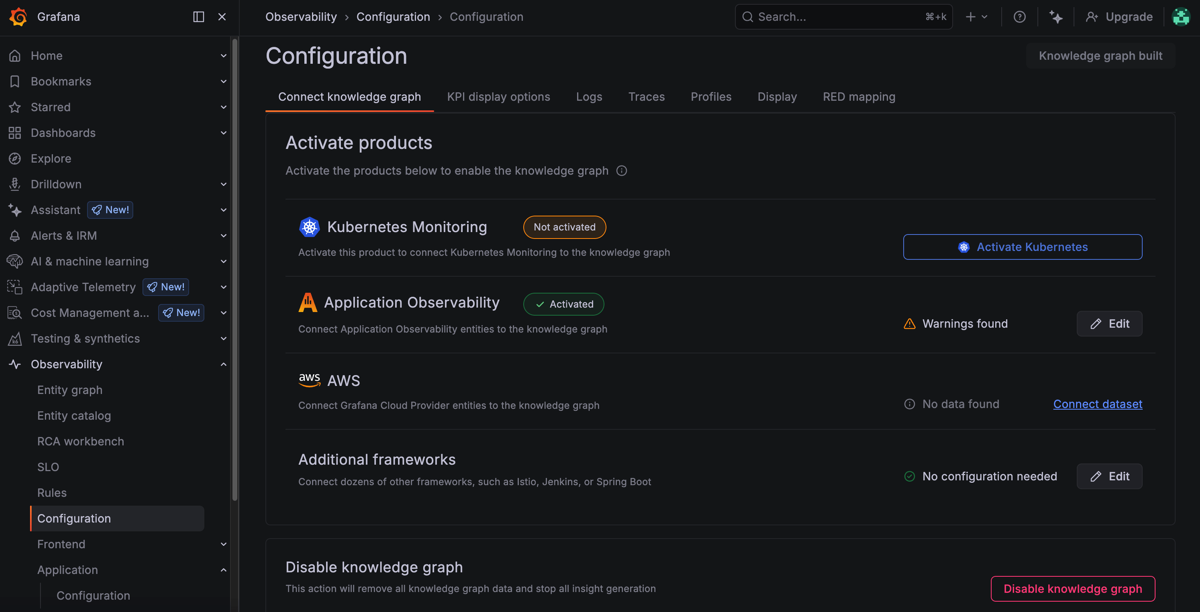
- Sign into Grafana Cloud and navigate to Observability > Configuration > Connect knowledge graph.
- Scroll to the bottom of the configuration page.
![Knowledge graph Connect knowledge graph page]()
- Click Disable knowledge graph.
- In the Disable knowledge graph dialog box, review what happens when you deactivate the knowledge graph.
- Type “disable.”
- Click I understand, disable knowledge graph to confirm.
What happens when you deactivate
When you deactivate the knowledge graph:
- Data collection stops: No new entities or insights are generated
- Dashboards removed: Pre-built knowledge graph dashboards are deleted
- Alert rules removed: Knowledge graph alert rule templates are deleted
- Entity catalog disabled: The entity catalog and RCA workbench become unavailable
- Integration links affected: Embedded drill-down links from Application Observability and Kubernetes Monitoring to the knowledge graph no longer function
- Cost implications: The knowledge graph extends Application Observability and Kubernetes Monitoring pricing. Deactivating the knowledge graph alone has minimal cost impact unless the base products are also deactivated.
Note
Historical entity data and insights remain in your metrics storage according to your retention policy, but the knowledge graph does not process or generate new insights.
Re-activating the knowledge graph
To re-activate the knowledge graph after deactivation:
- Return to Observability > Entity catalog.
- Follow the same activation steps as initial setup.
- Click Build Knowledge Graph to begin processing data.
The knowledge graph begins processing data again and rebuilding the entity graph. Entity discovery typically begins within minutes, with full graph population depending on your environment size.


