Detect customer-visible outages using Synthetic Monitoring
Welcome to the Grafana Cloud learning journey that shows you how to set up Synthetic Monitoring and create your first check to monitor endpoint availability from global probe locations.
Synthetic Monitoring is a blackbox monitoring solution that lets you test your applications and services from an external perspective. Unlike traditional monitoring that observes systems from within, Synthetic Monitoring emulates user behavior from probe locations around the world, giving you insight into how your services appear to actual users.
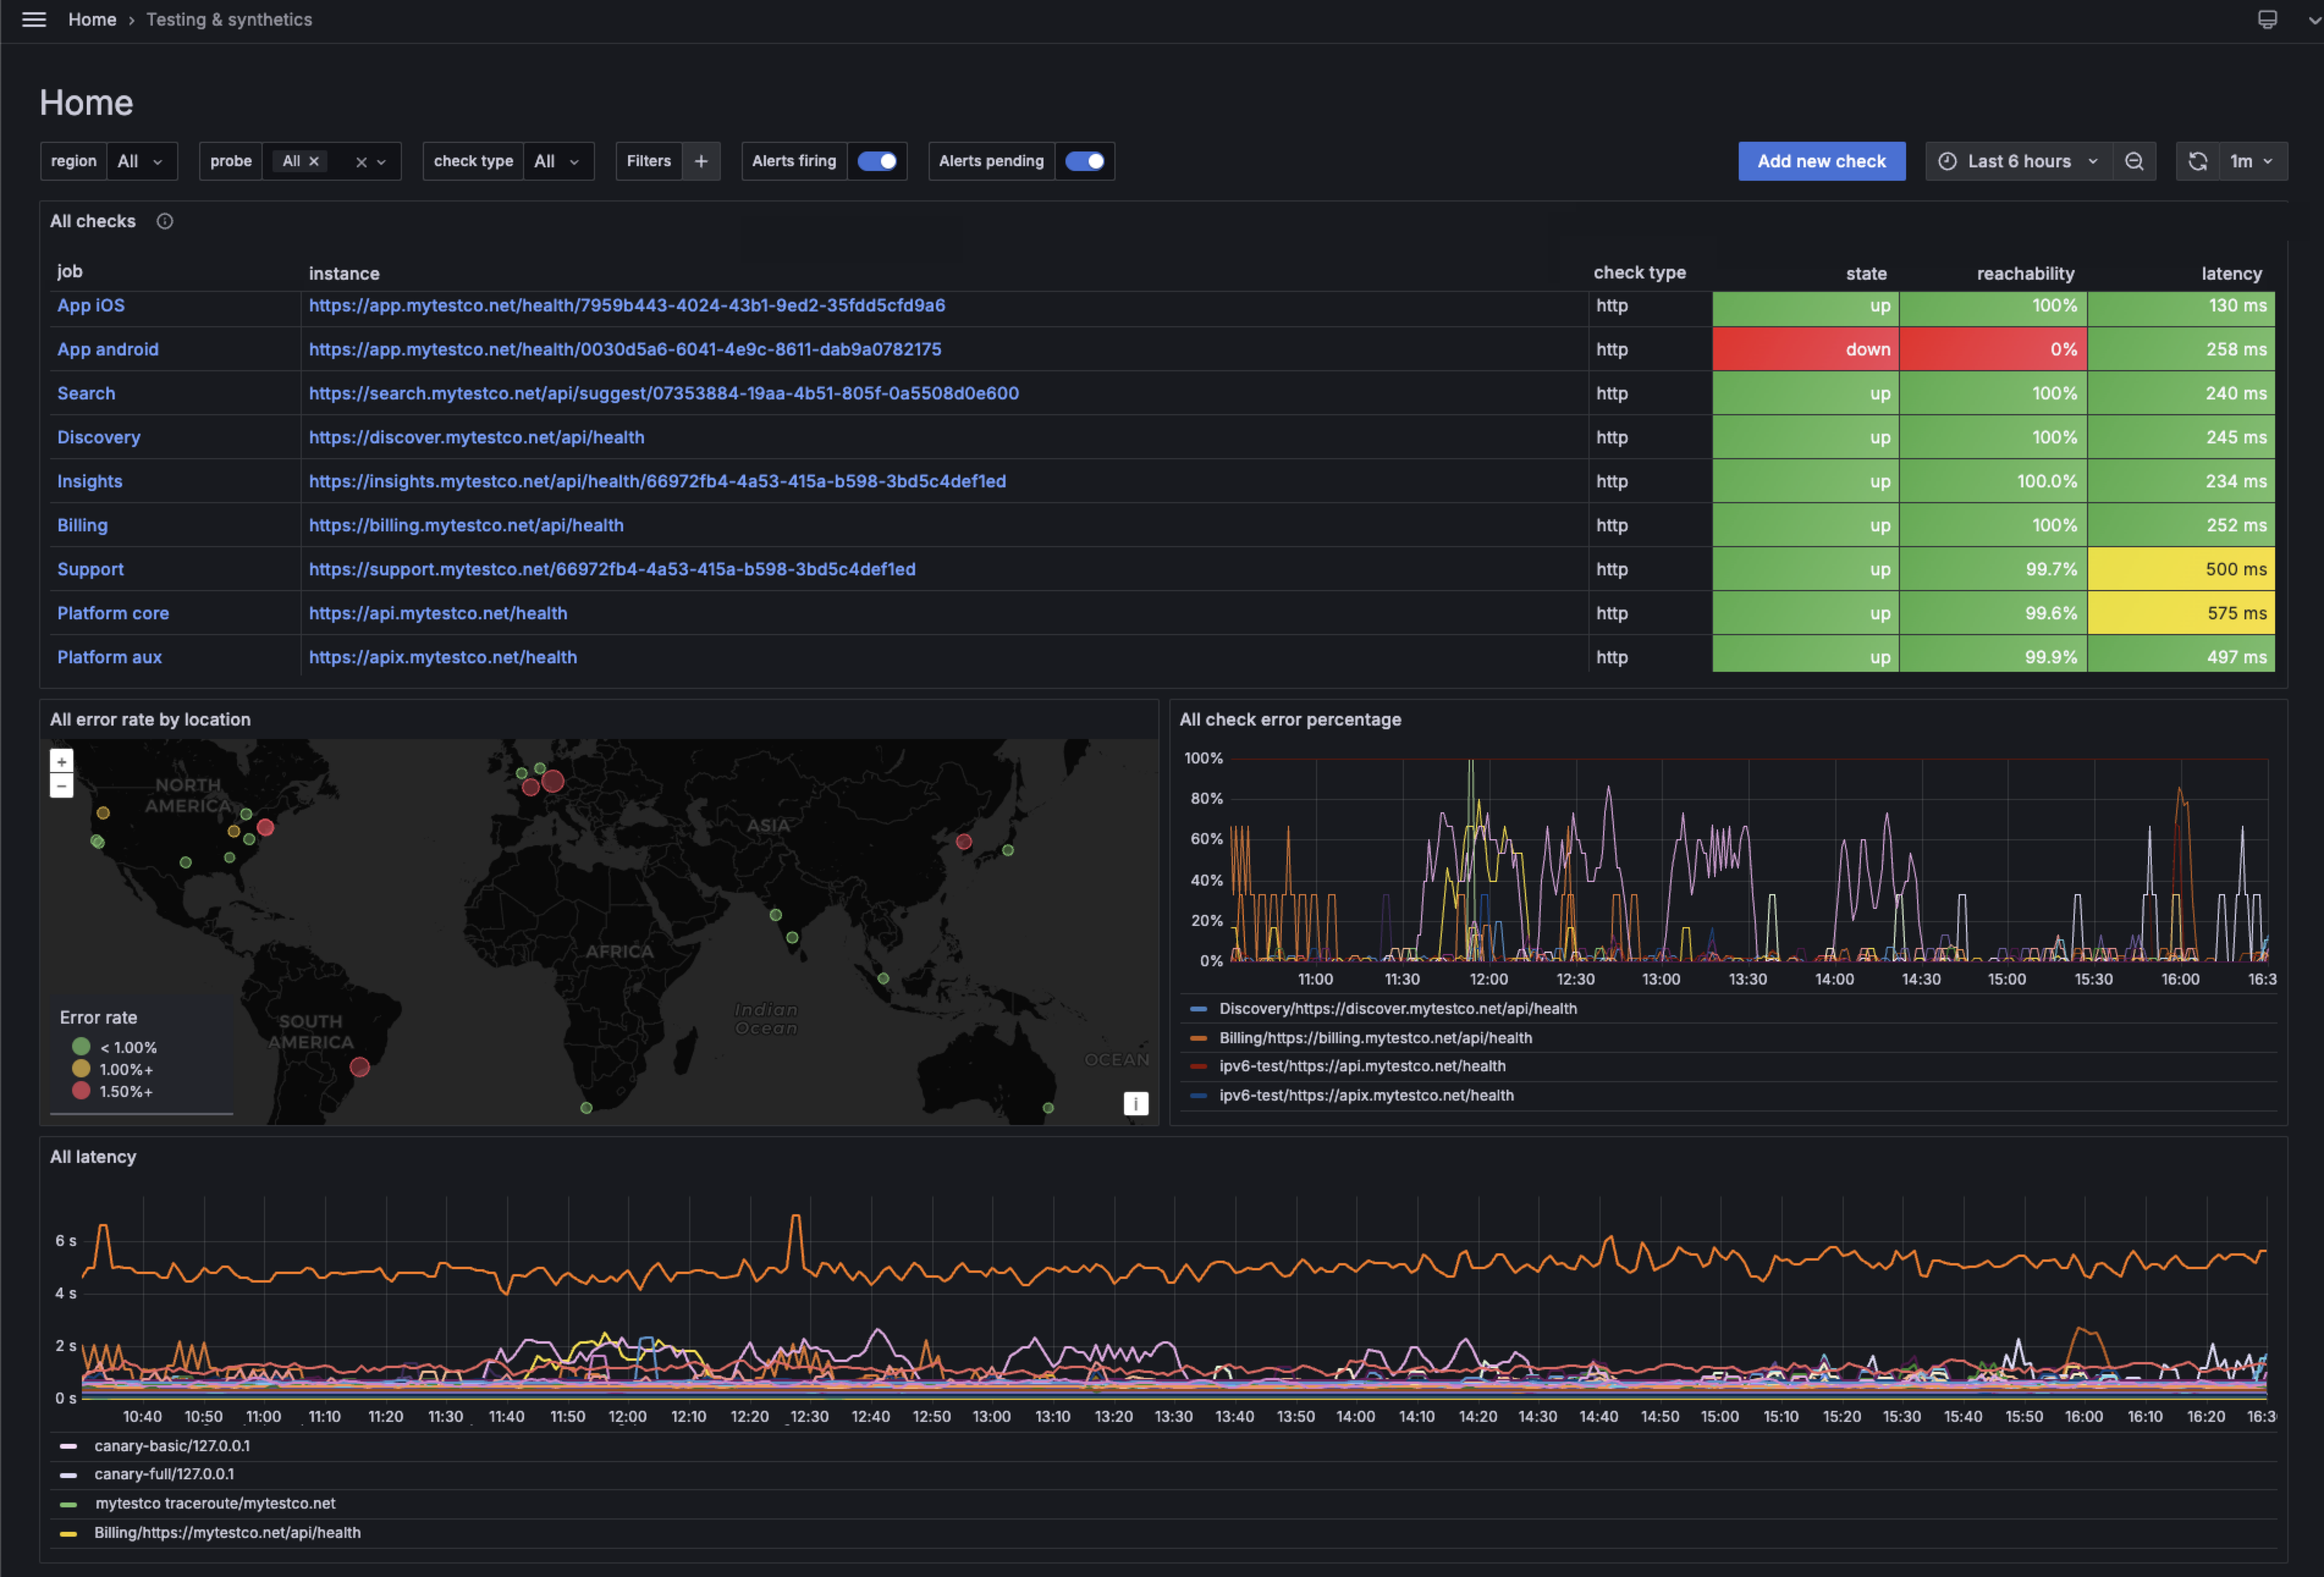
The following image shows the Synthetic Monitoring dashboard with an overview of check status, uptime, and latency metrics across probe locations.
Here’s what to expect
When you complete this journey, you’ll be able to:
- Understand the value of Synthetic Monitoring for proactive blackbox monitoring
- Navigate to Synthetic Monitoring in Grafana Cloud
- Initialize the Synthetic Monitoring plugin for your account
- Create a ping check to test endpoint reachability
- Select global probe locations to monitor from multiple regions
- View the check dashboard with uptime, latency, and reachability metrics
- Explore the time point explorer to analyze individual check executions
Before you begin
Before you get started with Synthetic Monitoring, ensure that you have:
- A Grafana Cloud account. To create an account, refer to Grafana Cloud.
- Access to your Grafana Cloud instance with permissions to install plugins.
- A target endpoint to monitor (you can use
grafana.comfor testing purposes).
Troubleshooting
If you get stuck, we’ve got your back! Where appropriate, troubleshooting information is just a click away.
More to explore
We understand you might want to explore other capabilities not strictly on this path. We’ll provide you opportunities where it makes sense.