View the check dashboard
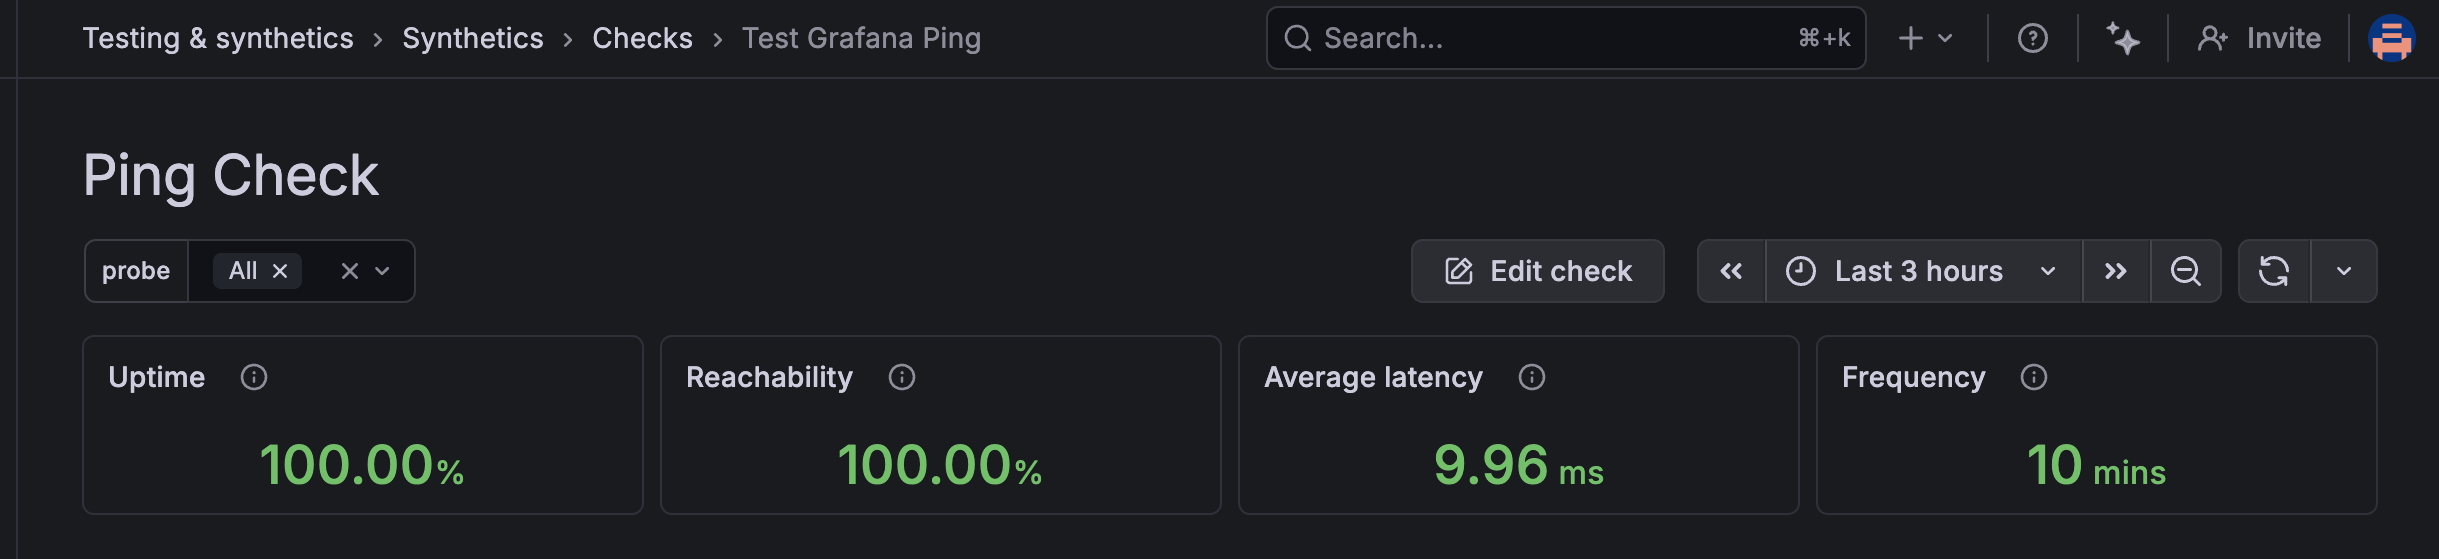
Each check in Synthetic Monitoring has a dedicated dashboard that displays key performance metrics over time. The dashboard provides a comprehensive view of your check’s health, including uptime percentage, reachability from each probe location, average latency, and error rates.
The check dashboard helps you identify trends and anomalies in your service’s availability and performance. You can filter by specific probe locations or time ranges to investigate issues and understand how your service behaves across different regions.
To view the dashboard for your check, complete the following steps:
- On the Checks page, locate your ping check in the list.
- On the check card, click View dashboard.
Tip
It can take 1-2 minutes for the first check to execute. If you see N/A in the panels, wait a moment and click the Refresh icon or adjust the time picker to Last 5 minutes.
- Review the Uptime panel to see the percentage of successful checks over the selected time range.
- Review the Reachability panel to see how often the target responds from each probe location.
- Review the Average latency panel to see response times from each probe location.
- Use the probe filter at the top of the dashboard to focus on specific locations.
- Use the time picker to adjust the time range for the displayed data.
If you have configured alerts for this check, you can use the alert toggles to overlay alert information on the dashboard.
Explore the time point explorer
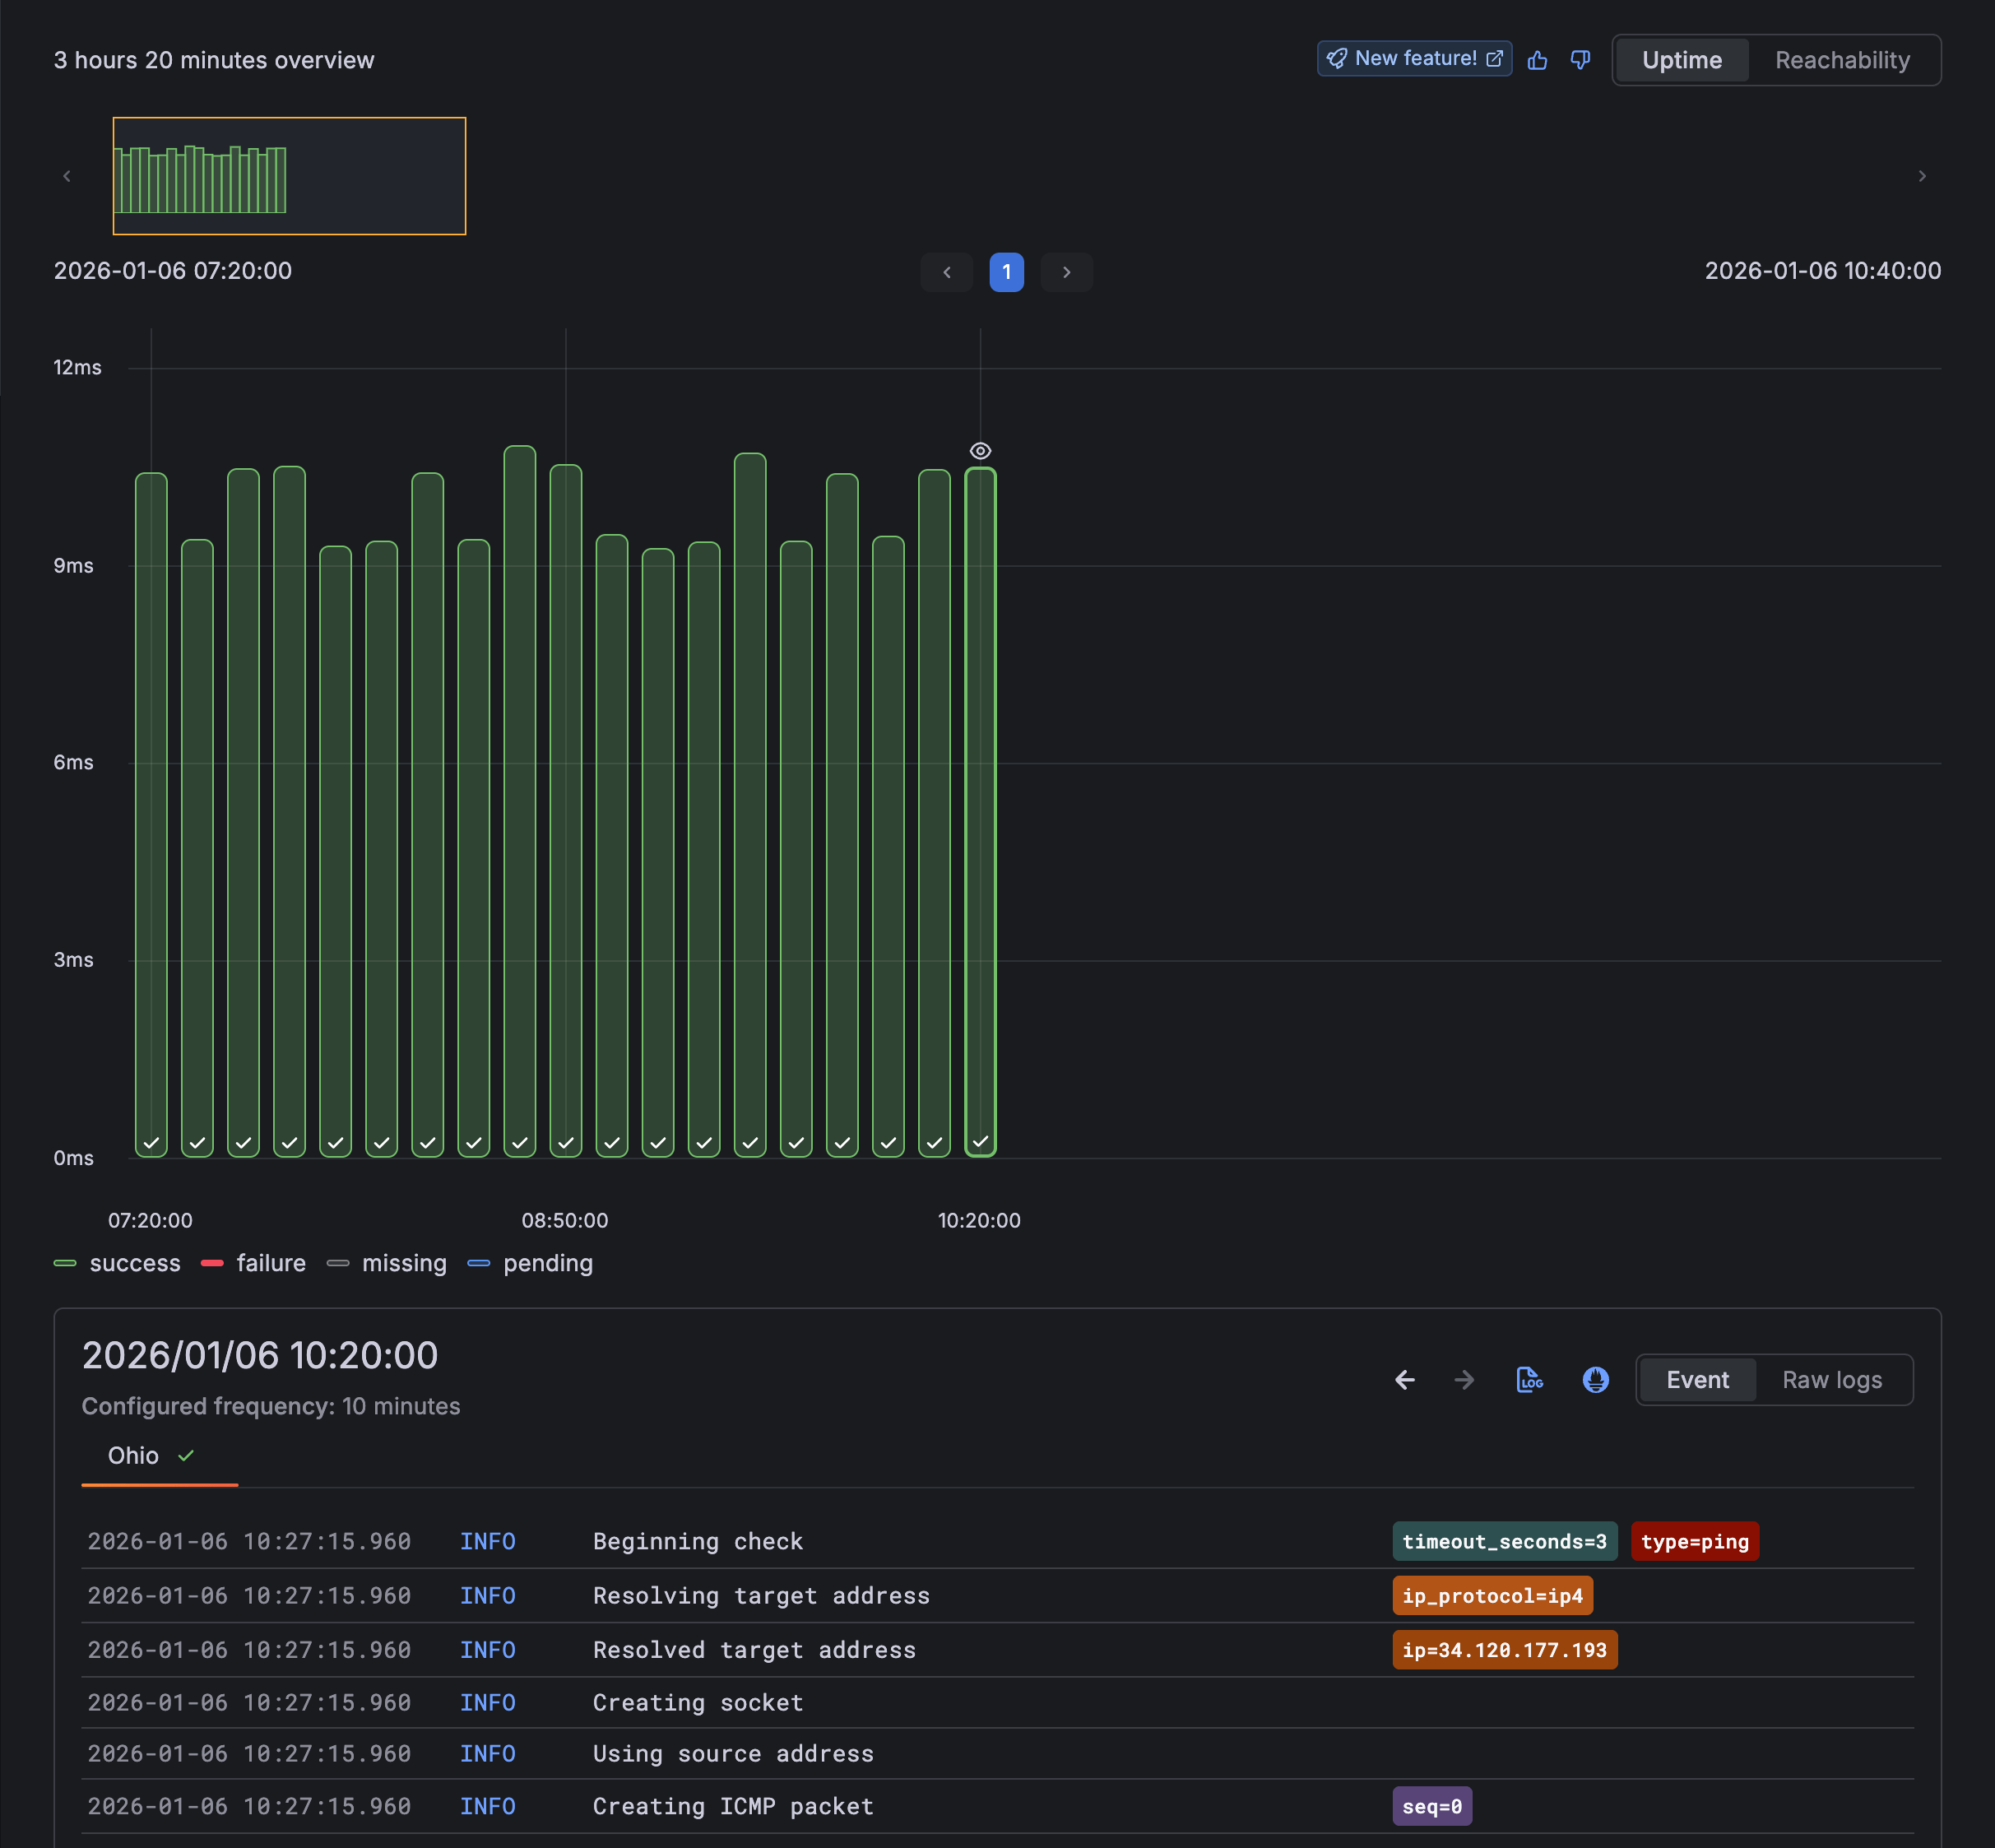
The check dashboard includes a time point explorer, a specialized visualization that combines logs and metrics to provide a detailed view of individual check executions. This tool is particularly useful when you need to analyze execution behavior rather than just looking at aggregated metrics.
To investigate a specific execution:
- Locate the Time point graph (the middle section with individual dots).
- Click on a specific data point (dot) in the graph.
- Review the Time point viewer at the bottom to see the logs, response headers, and execution details for that specific moment.
The explorer automatically refreshes when your time range includes pending executions, allowing you to watch new data arrive in real-time.
In the next milestone, you’ll review what you’ve accomplished in this journey.
At this point in your journey, you can explore the following paths: