

Grafana Plugin for the Yamcs Mission Control Software
A comprehensive Grafana plugin to connect to Yamcs servers for real-time telemetry visualization and commanding capabilities. Designed for mission control centers, aerospace applications and beyond.


Overview
A plugin that connects Grafana directly to the Yamcs server to display telemetry, send commands, inspect command history, monitor alarms, control Yamcs links, and synchronize dashboards with Yamcs processor time.
This plugin is engineered for high reliability to be used in Mission Control Centers and anywhere Yamcs is used.
The current version has been tested in real-world deployments, and active development continues.
Development is led by JAOPS: providing Mission Control software, tools and training for spacecraft in orbit and rovers on the Moon!
Catalog Information
The plugin includes in-app tutorials for each panel.
| Grafana Catalog | jaops-yamcs-app |
| Latest catalog version | |
| Status |  |
| Signature |


|
| Grafana dependency |  |
| Catalog downloads | |
Plugin Parts
| Icon | Plugin Part | Capability |
|---|---|---|
 |
Yamcs Datasource | Connects Grafana to Yamcs endpoints, queries telemetry, streams realtime values, exposes backend resources, and reports endpoint health. |
 |
Commanding Panel | Issues commands via a Grafana panel with fully customizable buttons, supporting arguments, comments, and endpoint targeting. |
 |
Command History Panel | Keeps track of commands sent, arguments, acknowledgements, and command execution state. |
 |
Telemetric Image Panel | Visualizes realtime image data from Yamcs telemetry. |
 |
Static Image Panel | Overlays telemetry data on static images such as spacecraft layouts, maps, or operator schematics. |
 |
Variable Setting Panel | Provides operator-friendly dashboard variable controls for commanding and filtering workflows. |
 |
Alarms Panel | Displays active Yamcs alarms and supports alarm-focused operations from Grafana. |
 |
Links Panel | Displays Yamcs data links and lets operators enable or disable them from Grafana. |
 |
Yamcs Time Sync | Visualizes replays and future simulations through synchronization between Grafana and the Yamcs clock. |
Features
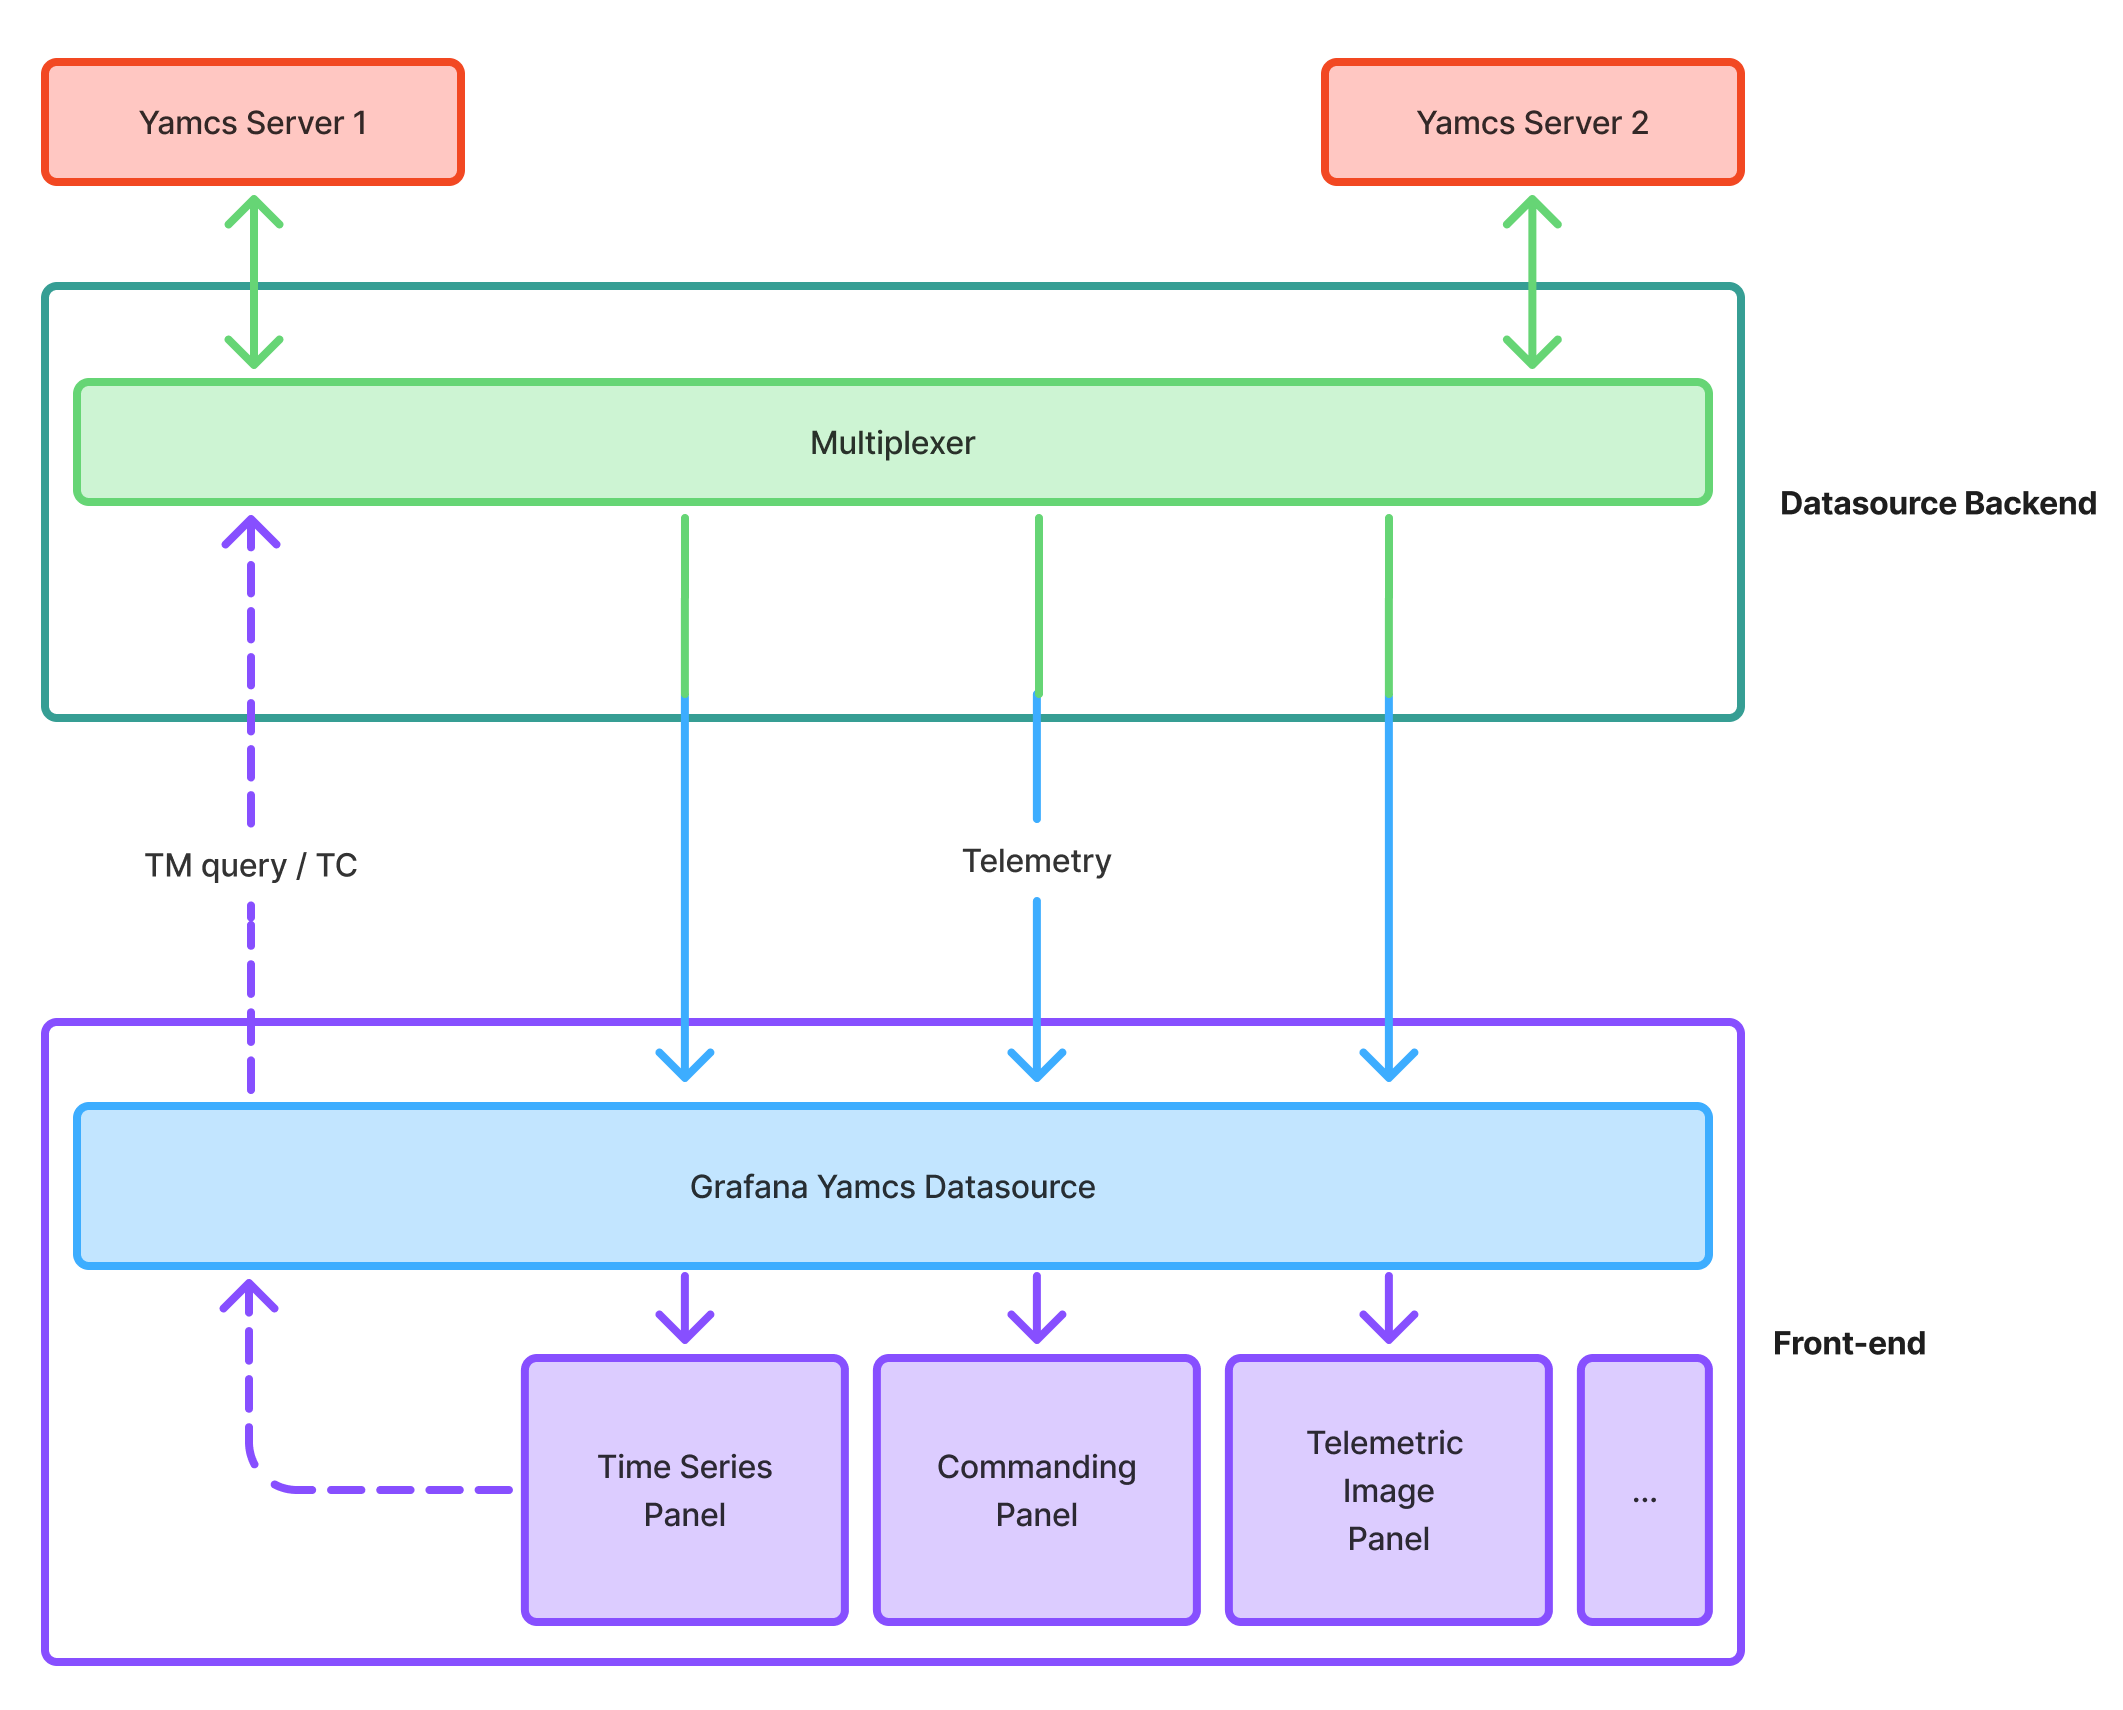
Multiplexed Endpoint Support - Designed to handle complex setups with multiple Yamcs endpoints through a robust multiplexer system. Supports scaling to many Grafana clients efficiently by multiplexing the connections to Yamcs: the same data is only requested once.
Modular and Scalable Architecture - Clean separation of concerns and a solid backend structure built for reliability and flexibility.
Telemetry & Static Image Panel - Visualize real-time telemetry data or overlay data on static images, such as spacecraft layouts and maps.
Commanding Panel - Issue commands via a Grafana panel with fully customizable buttons, supporting arguments, comments, and endpoint targeting.
Intuitive UI/UX - Clean and simple user interface designed to be easy to use, even for non-experts.
Live Status Feedback - Displays endpoint availability and WebSocket status in real-time, ensuring quick diagnostics.
Fully Configurable - Every aspect of the plugin, from endpoint configuration to command structure and visual layout, is configurable through Grafana's settings.
Replay/Simulation support - Visualize replays and future simulations through synchronization between Grafana and Yamcs clock.
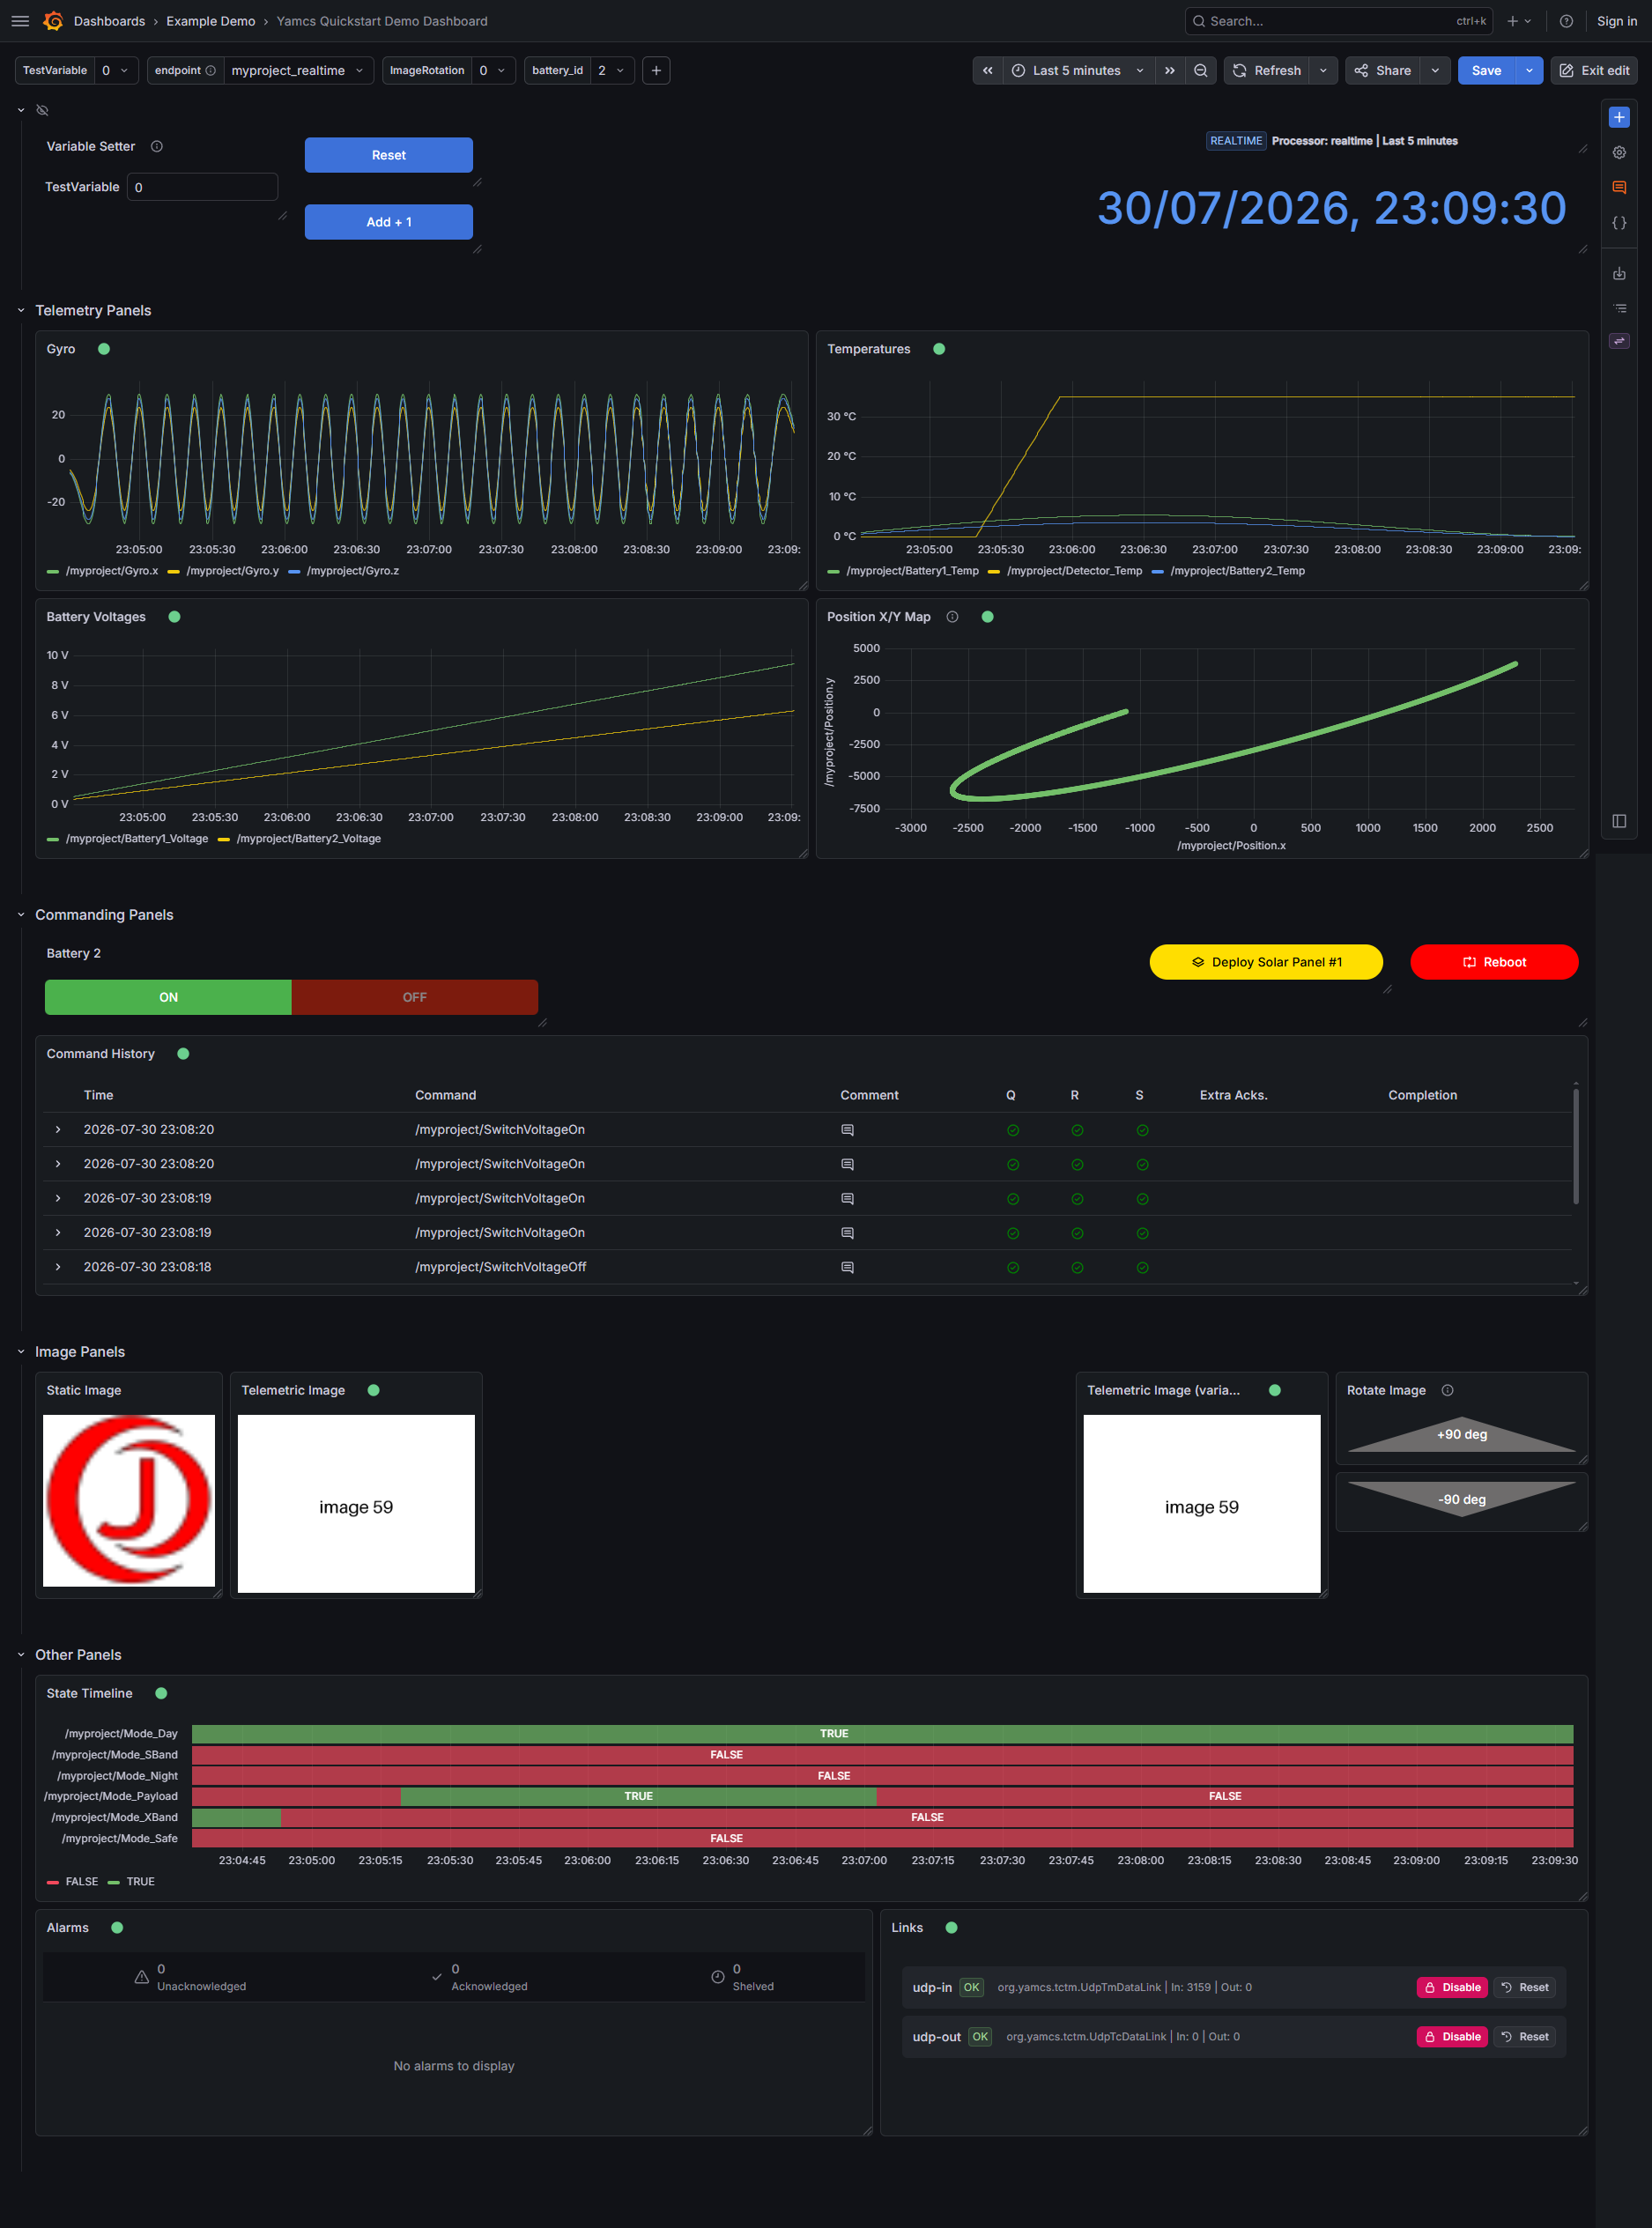
Example Grafana Dashboard Connected to Yamcs
Demo dashboards showcase the main capabilities of the plugin. They are made to use data from the Yamcs Quickstart.
To try it with a local Yamcs demo, clone the JAOPS Yamcs Quickstart repository and run:
./mvn yamcs:run
In another terminal, start the simulator:
python3 simulator.py
For image telemetry panels, you can also run the optional image simulator:
python3 simulator/images/generate_images.py
Acknowledgements
Since October 2024, the plugin has been tested and improved with feedback from the Space Robotics Lab of Tohoku University in Sendai, Japan.
Grafana Cloud
Connect any plugin in Grafana Cloud.
- 150+ data source integrations
- Grafana Assistant - AI that correlates your data, builds queries, and answers questions
- 10k Prometheus metrics + 50 GB logs, traces, and profiles on the free tier
- ...and more
Insights
- Adoption
Running on 34 active Grafana instances.
- Activity
Last updated 19 Nov 2026.
1 release in the past year.
- Version
- 1.1.11
- Dependencies
- Grafana >=12.1.1
- Developer
- jaops
Grafana Cloud
Connect any plugin in Grafana Cloud.
- 150+ data source integrations
- Grafana Assistant - AI that correlates your data, builds queries, and answers questions
- 10k Prometheus metrics + 50 GB logs, traces, and profiles on the free tier
- ...and more